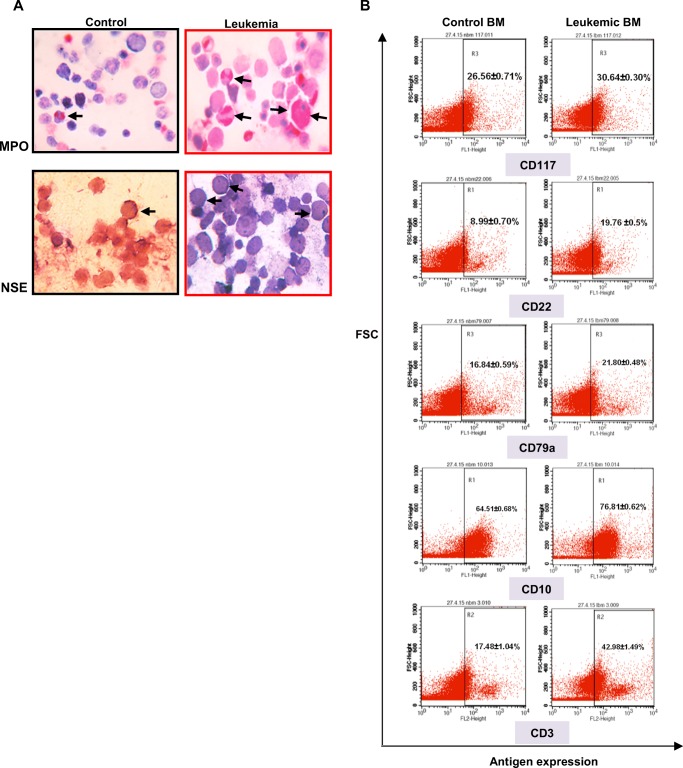
Fig. 2. Cytochemistry and immunophenotyping.
aLeft panel: Control BM showed very few numbers of MPO and NSE positive cells. Right panel: Leukemia BM showed large numbers of intense MPO and few NSE positive cells (black arrows) [Magnification 1000X]. b Leukemia BM showed positive expression for myeloid (CD117) as well as lymphoid (B-lymphoid: CD22, CD79a and CD10 and T-lymphoid: CD3) lineage specific antigens (right panel). Control BM showed basal level of antigen expression (left panel)

