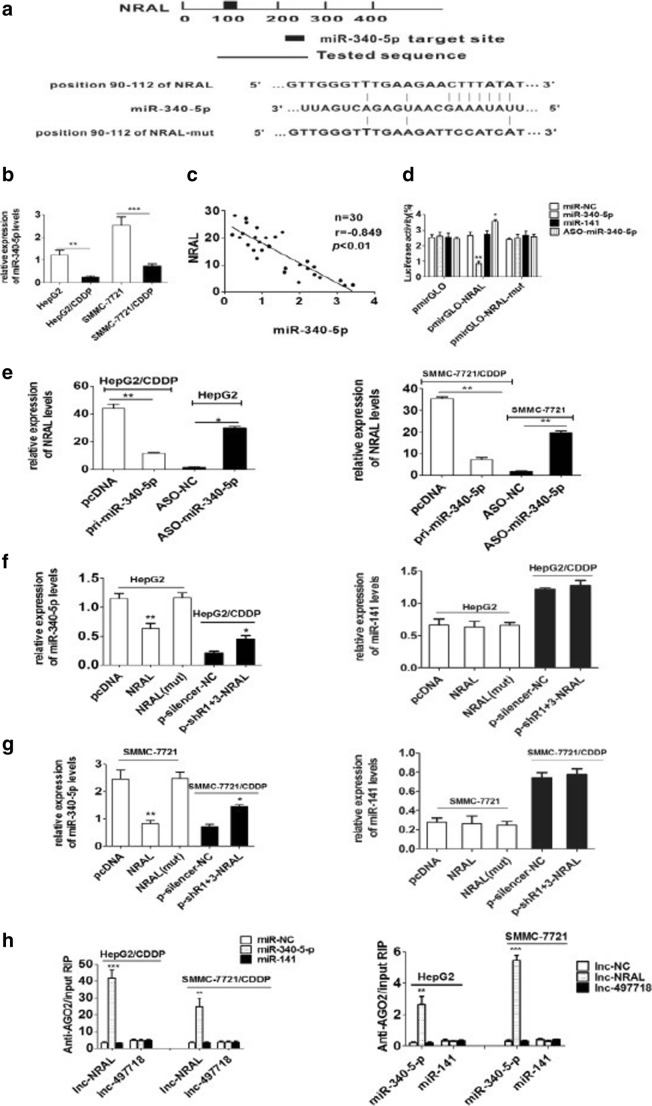
Fig. 4.
NRAL is targeted by miR-340-5p (a) Schematic diagram of the miR-340-5p putative binding site in NRAL according to RNA22 software; the mutant seed sequence of miR-340-5p is shown in Fig. 4. (b) qRT-PCR was performed to validate the expression levels of miR-340-5p in HepG2/CDDP and SMMC-7721/CDDP cells and their parental counterparts. U6 was used as an internal control for normalizing the data, **p < 0.01, ***p < 0.001. (c) Correlations between the levels of miR-340-5p and NRAL in 30 HCC tissue samples according to Pearson’s correlation analysis (r =-0.849, P< 0.01). (d) Relative luciferase intensities of the luciferase constructs harbouring wild-type or mutant NRAL were measured in 293T cells 48 hrs after transfection with miR-340-5p or ASO-miR-340-5p, n=3, *p < 0.05, **p < 0.01 vs the miR-NC group. (e) Relative NRAL gene expression was assessed by qRT-PCR in HCC cell lines transfected with miR-340-5p or ASO-miR-340-5p, n=3, *p < 0.05, **p < 0.01. (f-g) Relative miR-340-5p gene expression was analysed by qRT-PCR assays in HCC cell lines with NRAL overexpression or suppression. (*P < 0.05; **P < 0.01 vs the NC group) (h) RIP experiments were performed to detect the interaction between NRAL and miR-340-5p. The relative RNA levels of NRAL and miR-340-5p in the immunoprecipitants were determined by qRT-PCR. NRAL and miR-340-5p data are presented as the fold enrichment in AGO2 cells relative to IgG immunoprecipitants. The columns are the mean of three independent experiments; the data are expressed as the mean±SD. **p < 0.01, ***p < 0.001 vs the other group

