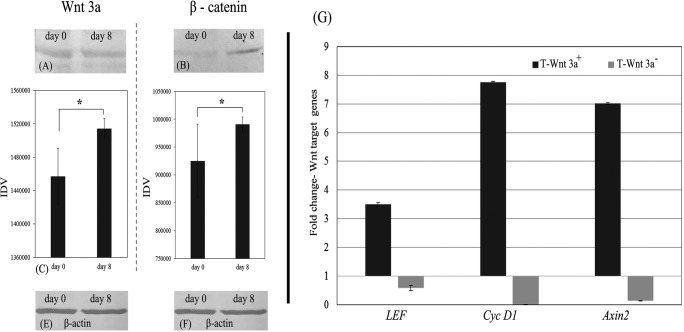
Fig. 4.
Demonstration of Wnt3a and its effectors in cells: a-f Western blot analysis data; a shows Wnt protein in NPCs on day 0d and 8d of culture on test matrix (‘T’); b shows β-catenin protein in NPC on day 0d and 8d of culture on test matrix (‘T’); c Quantified Western blot band intensity of Wnt (40 kDa) on day 0d & 8d of culture; d Quantified Western Blot band intensity of β-catenin (92 kDa) day 0 & 8d of culture; e & f β-actin in NPC on day 0 and 8d of culture on test matrix (‘T’), respectively; *marks P < 0.05 estimated by t-test; g Quantitative RT-PCR data showing up regulation and down regulation of Wnt target genes - LEF1, Cyc D1 and Axin2 upon adding Wnt3a protein and chemical inhibitor to the test matrix (‘T’), respectively, as compared to the baseline gene expressions in cells grown on test matrix (‘T’). Graphical data is average ± S.D. of 3–6 replicates

