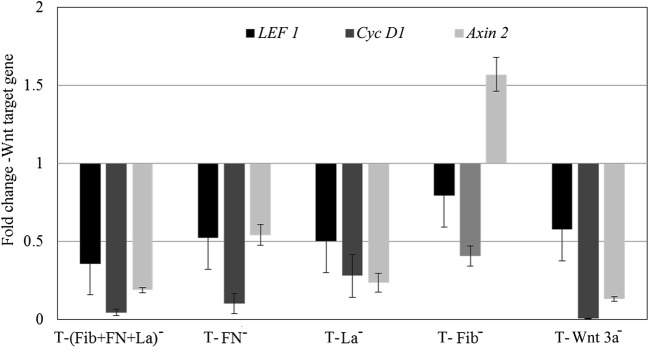
Fig. 5.
Effect of different antibodies on Wnt gene expressions. The graphical representation of the effect of antibodies against fibronectin (FN), fibrin (Fib), and laminin (La) upon their exposure with test matrix (‘T’) individually and in combination on the regulation of target genes- LEF, Cyc D1 and Axin2, as compared to the baseline value in test matrix (‘T’) is shown. Graphical qRT-PCR data is average ± S.D. of 3 replicate experiment

