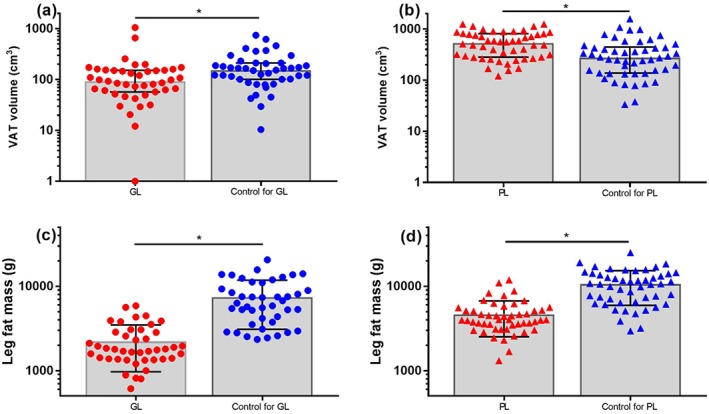
Figure 1.

Visceral adipose tissue (VAT) volume (a and b) and leg fat mass (c and d) in patients with generalized lipodystrophy (GL, red circles) and partial lipodystrophy (PL, red triangles) versus age‐matched and sex‐matched controls (blue circles and triangles). VAT volume was zero in one patient with GL, coded as 1 to permit display on a logarithmic scale. * p < 0.05.
