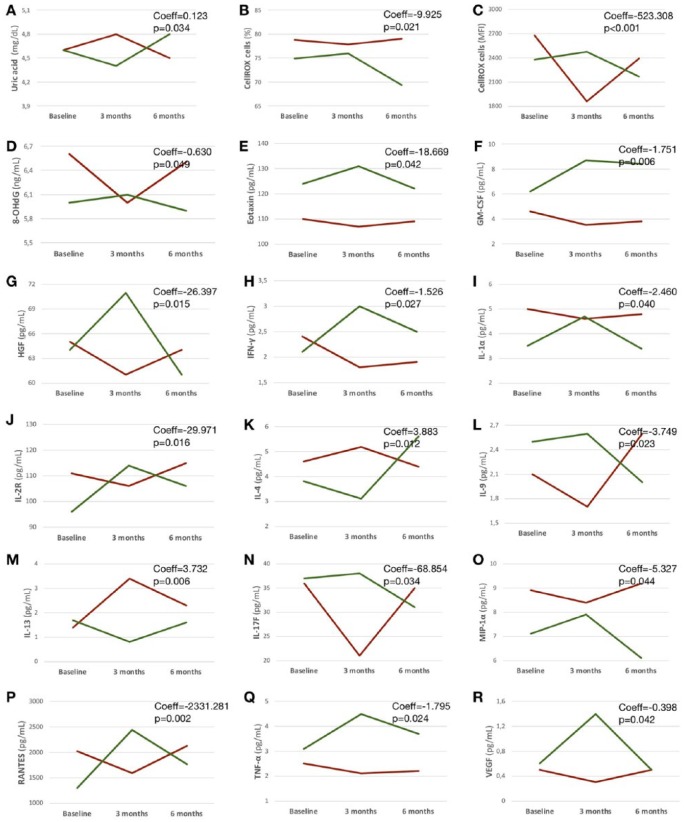
Figure 2.
Laboratory outcomes.
Profile plots show variations of laboratory outcomes over time in relation to the use of IFN-β1a alone or in combination with Coenzyme Q10 (Group 1: group receiving Coenzyme Q10 from baseline to 3-month follow up is in red; Group 2: group receiving Coenzyme Q10 from 3- to 6-month follow up is in green). Coefficients (Coeff) and p values are shown from mixed-effect linear regression models where an interaction term between treatment and time was set and marginal effects were calculated.
IFN-β1a, interferon-beta1a.

