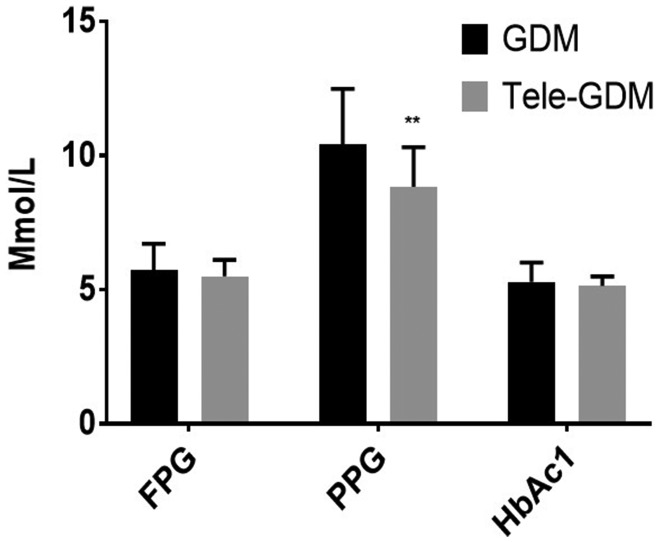
Figure 3.
Results of laboratory investigations, including FPG, 2-hour PPG and glycated haemoglobin (HbA1c) are compared between the Tele-GDM and control groups. Values are expressed as mean ± standard error of the mean. Statistical significance was determined by unpaired t-tests (n =57); **P < 0.001.

