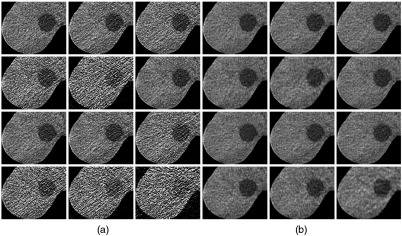
Fig. 2.
Comparison of 24 CT acquisitions of the liver phantom (displayed at WL 40, WW 350): (a) 12 FBP images and (b) 12 AIDR 3D images. Tube currents: first row ATCM SD 7.5, ATCM SD 9.5, and ATCM SD 12. Second row ATCM SD 15, ATCM SD 25, and 200 mA. Third row 150, 100, and 50 mA. Fourth row 30, 20, and 10 mA.

