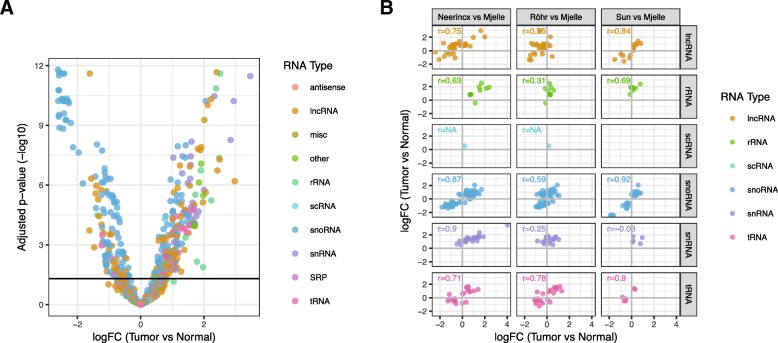
Fig. 2.
Several sRNAs classes are consistently differentially expressed. a Volcano plot showing expression differences for individual ncRNAs between tumor and normal (see Fig. 1b). Each RNA type is shown with a unique color. b Scatterplots comparing fold-change values between datasets for different ncRNA types (see Fig. 1d)

