Fig. 4.
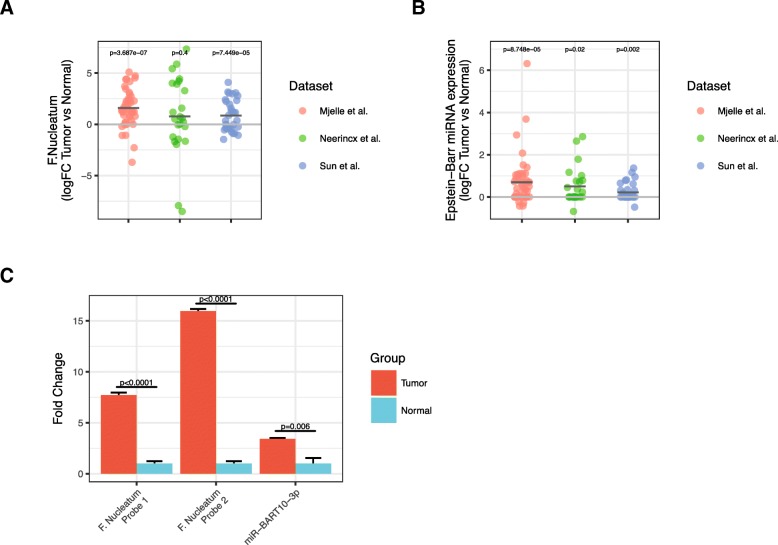
Expression of bacteria and virus RNAs in CRC tissue. a, b Fold-change values between paired tumor and normal tissue for (a) F. nucleatum and (b) Epstein-Barr virus in the Neerincx, Sun, and our datasets. c Bar-plot showing RT-qPCR validation of two probes against F. nucleatum and miR-BART10-5p. The normal samples are set to 1 and the error bars represent the standard deviation from three technical replicates. The experiment included 8 normal samples and 8 tumor samples

