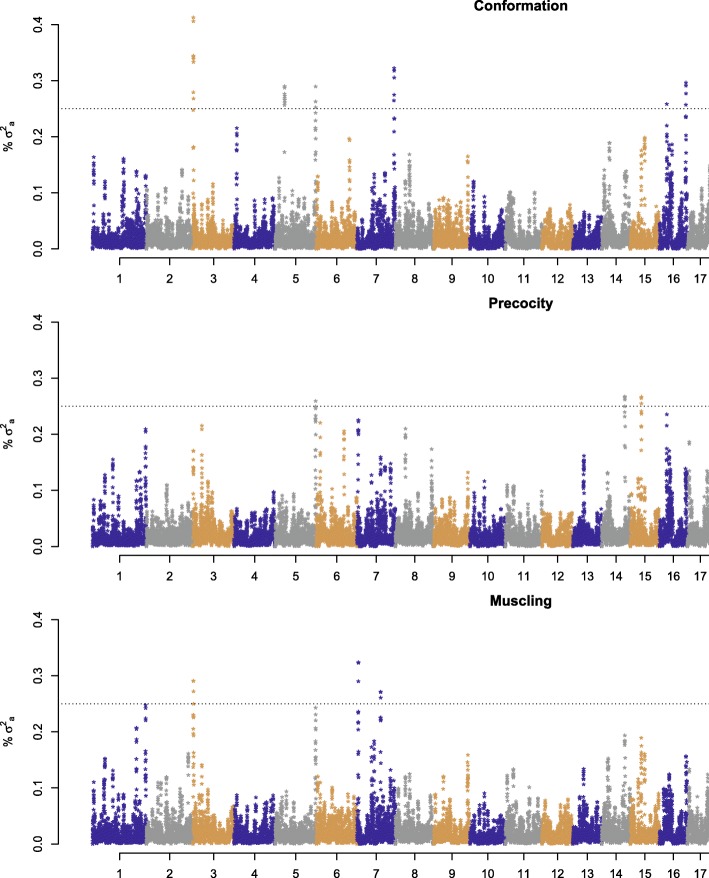
Fig. 1.
Percentage of genetic variance explained by windows in each chromosome using the Bayesian approach BayesC, considering phenotype as the dependent variable of visual scores for conformation, precocity and muscling. Dotted lines mark the 0.25% threshold of genetic variance explained by the windows

