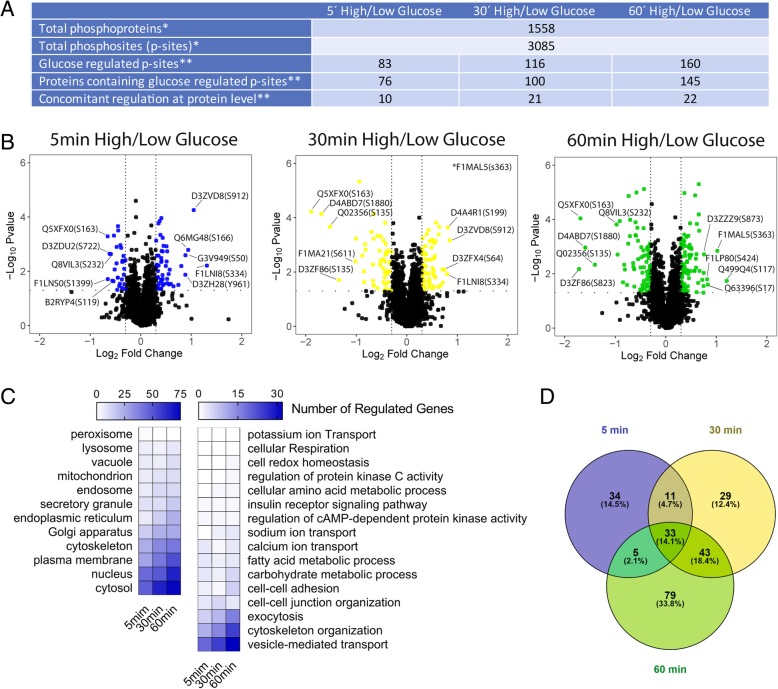
Fig. 2.
Glucose-dependent regulated phosphoproteins and phosphorylated sites (p-sites) overtime. a Table (*successfully quantified at least twice in all experimental conditions; **p-value < 0.05 and FC (Log2) > 0.3 or < − 0.3). b Volcano plots displaying the distribution of significant regulated p-sites overtime. P-sites significantly changed (p-value < 0.05) and FC (Log2) > 0.3 or < − 0.3 compared to control are shown in color. c Heat maps, showing enrichment of cell process related with insulin secretion, and cell localization / organelle enrichment. d Venn diagrams showing numbers and percentages of common and differentially regulated p-sites overtime

