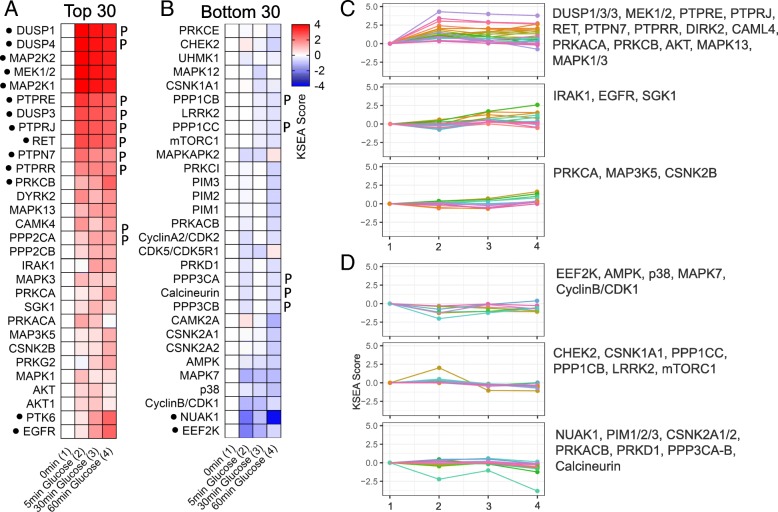
Fig. 5.
Kinase substrate enrichment analysis over a time-course. a Heatmap showing distribution of top 30 KSEA scores kinase and phosphatases (highlighted with “P”) activities after 5, 30 and 60 min of continuous glucose stimulation. b Heatmap showing distribution of bottom 30 KSEA scores kinase and phosphatase activities after 5, 30 and 60 min of continuous glucose stimulation. For kinases, high and low KSEA scores denote activation and inhibiton respectively; conversely for phosphatases, high and low KSEA scores denote inhibiton and activation respectively. Kinases and phosphatases displaying KSEA scores <− 2 or 2 < are highlighted with a black dot. c-d Trajectory clusters reporting temporal profiling of individual kinase/phosphatase activities. c Clusters undergoing positive KSEA scores upon glucose stimulation. d Clusters undergoing negative KSEA scores upon glucose stimulation

