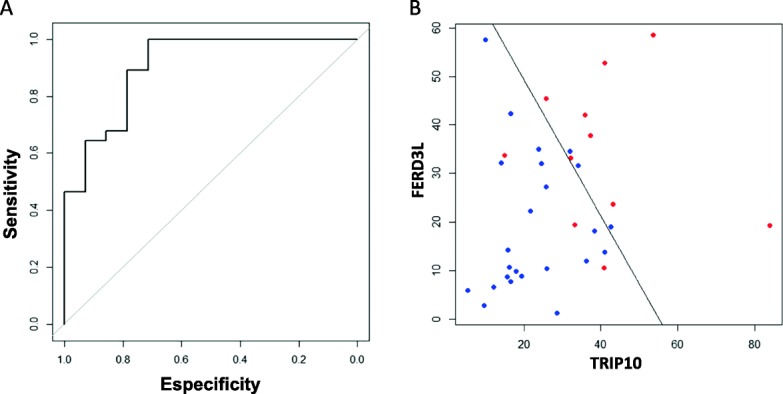
Fig. 5.

FERD3L and TRIP10 genes as predictive markers of pathological complete response (pCR) in TNBC patients. a The ROC curve for FERD3L and TRIP10 show graphically the connection/trade-off between clinical sensitivity and specificity. The area under the ROC curve (AUC) was 0.905 (95% CI = 0.805–1.000). b Based on the algorithm of the methylation status of FERD3L and TRIP10 in patients with TNBC, when the score was > 971, the probability to get a RCB = 0 was of 78.6%. For values lower than 971, the probability to get a RCB = 0 was of 10.7%. Red points represent patients with clinical RCB = 0 and in blue are indicated those patients with clinical RCB > 0. To the right of the line, patients has been classified as RCB = 0 and to the left as RCB > 0 by our algorithm
