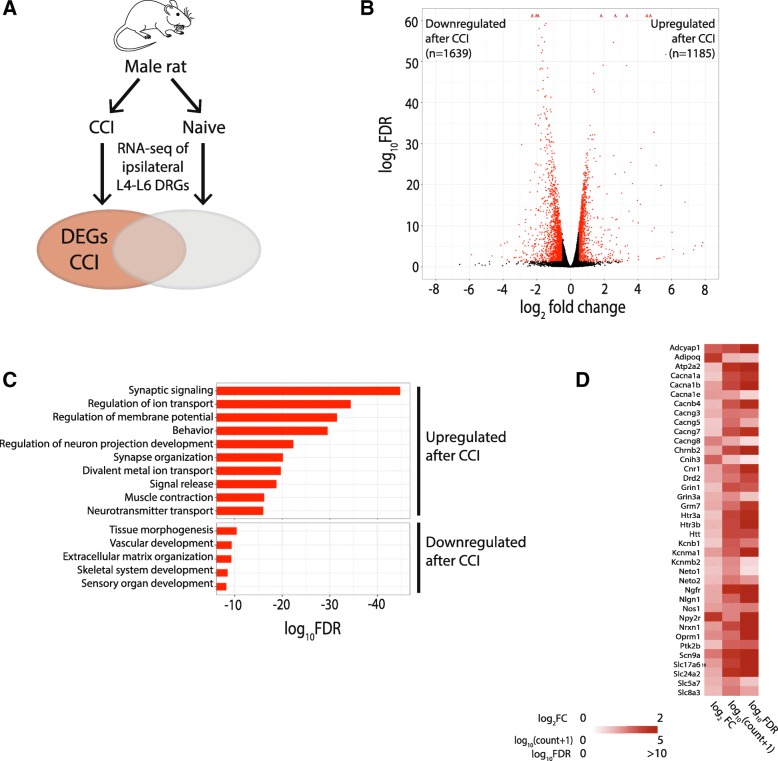
Fig. 3.
Differential gene expression between CCI and naïve groups in male rats. a Schematic diagram of experiment. Male rats were randomly assigned to the naïve group or receive CCI. RNA-seq performed on ipsilateral L4-L6 DRGs from each animal. Differentially expressed genes (DEG) are defined as genes expressed after CCI versus naïve with a |log2FC| > 0.5 and an adjusted p-value < 0.05. b Volcano plot showing RNA-seq data of DRGs from naïve male rats and male rats following CCI. DEGs are designated in red. Triangles represent genes with extremely high log10FDR values. c Gene ontology pathways associated with increased (top) and decreased (bottom) differential expression in CCI versus naive. d Heatmap that shows the log2FC, log10(gene count + psuedocount of 1), and the –log10FDR for the upregulated genes enriched in the top 3 GO terms shown in c). DRG dorsal root ganglia, CCI chronic constriction injury, FC fold change, FDR false discovery rate

