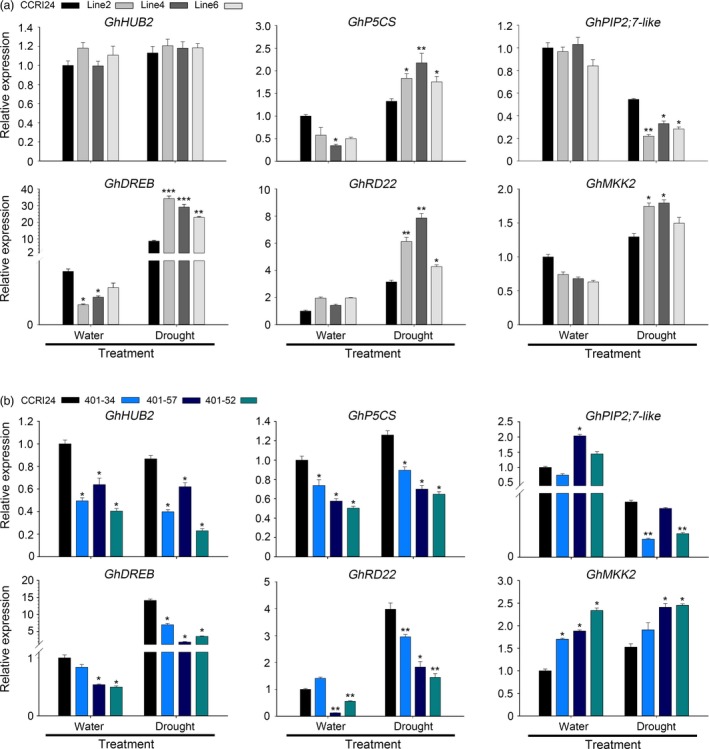
Figure 4.

RT‐qPCR analyses of the expression of stress‐responsive genes in control, AtHUB2 overexpression lines (a) and GhHUB2‐knockdown lines (b). The RNA extracted from the leaves of the indicated genotypes (4 weeks old) before or after air‐drying for 4 h. Values determined via RT‐qPCR were normalized to the expression of GhUBI1. Vertical bars represent the SD. (*P < 0.05; **P < 0.01, ***P < 0.001).
