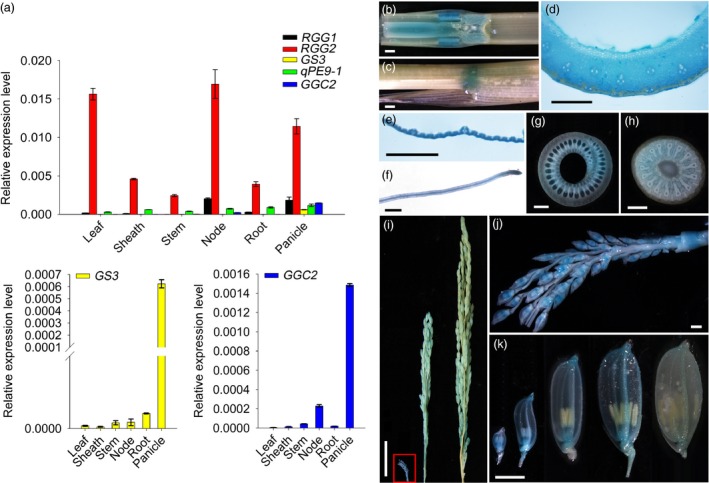
Figure 3.

Expression pattern of RGG2. (a) Transcript levels of five rice Gγ subunit‐encoding genes in various tissues detected by qPCR. OsActin was used as the internal control. The magnified images of GS3 and GGC2 expression pattern are further displayed at the bottom of the figure because the expression levels of these two genes are extremely low. (b) GUS activity in a stem and node longitudinal section. Bar = 1 mm. (c) GUS activity in a sheath. Bar = 1 mm. (d) GUS activity in a stem cross‐section. Bar = 1 mm. (e) GUS activity in a leaf. Bar = 1 mm. (f) GUS activity in a root. Bar = 1 mm. (g) GUS activity in a sheath cross‐section. Bar = 1 mm. (h) GUS activity in a node cross‐section. Bar = 1 mm. (i) GUS activity in panicles at different growth stages. Bar = 3 cm. (j) A magnified image of the boxed young inflorescence shown in (i). Bar = 1 mm. (k) GUS activity in spikelet hulls from 2‐ to 3‐, 8‐ to 9‐, 12‐ to 13‐, 19‐ to 20‐ and 23‐ to 24‐cm‐long inflorescences. Bar = 2 mm.
