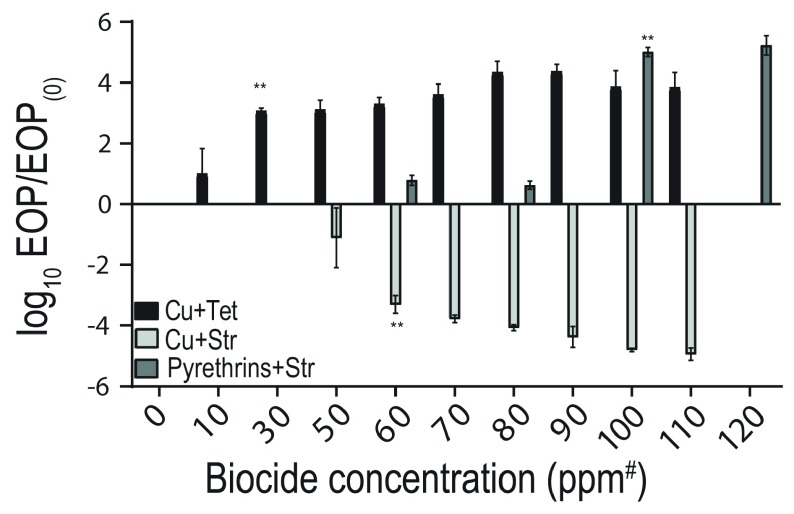
Figure 2. Dose response curves for E. coli BW25113.
Antibiotic concentrations used (in µg/mL) were as follows: Tet: 10 µg/mL for copper; Str: 2 µg/mL for copper and 10 µg/mL for pyrethrins. Values are means of at least 3 independent experiments; error bars are standard errors (SEM, with SEM=standard deviation/√n). Asterisks indicate the lowest biocide concentration for which a statistically significant change in EoP by at least 100-fold compared to the antibiotic only occurred. * P<0.05; ** P<0.01; *** P<0.001; ns, not significant.

