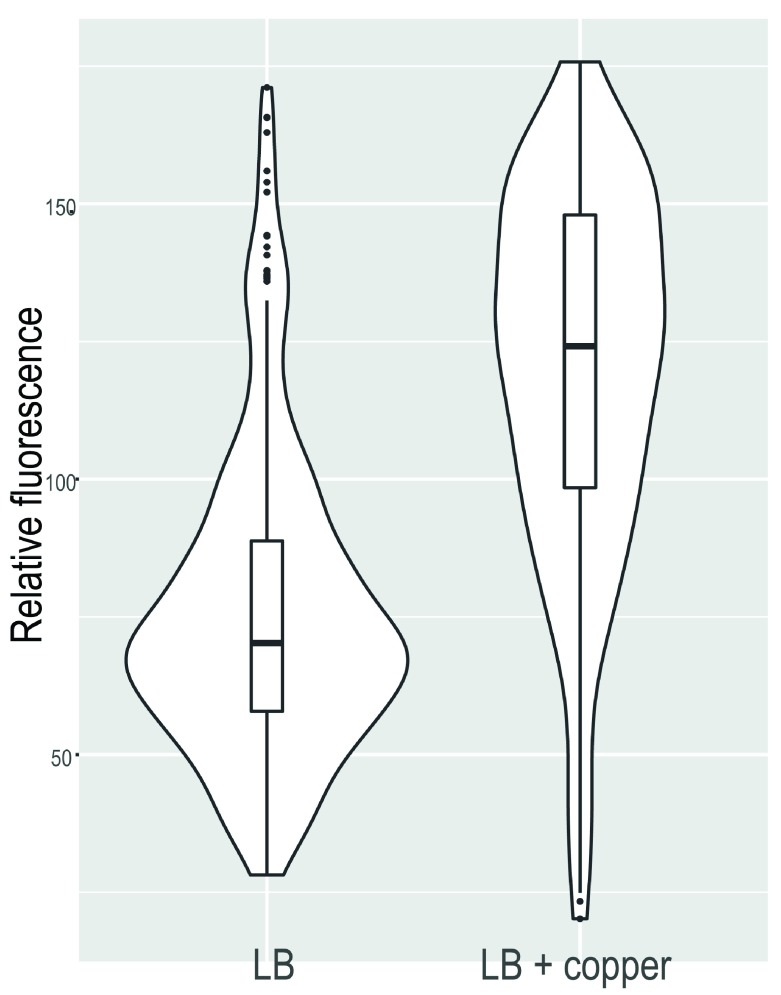
Figure 4. Single-cell fluorescence intensity of E. coli BW25113 (pHJ101) expressing red fluorescent mScarlet protein under the control of the tolC promoter without (left) or with (right) copper exposure.
The violin plots show the distribution of the single-cell fluorescence within the cell population. The median is depicted by the bar in the box; the box represents the 25% and 75% quartiles.

