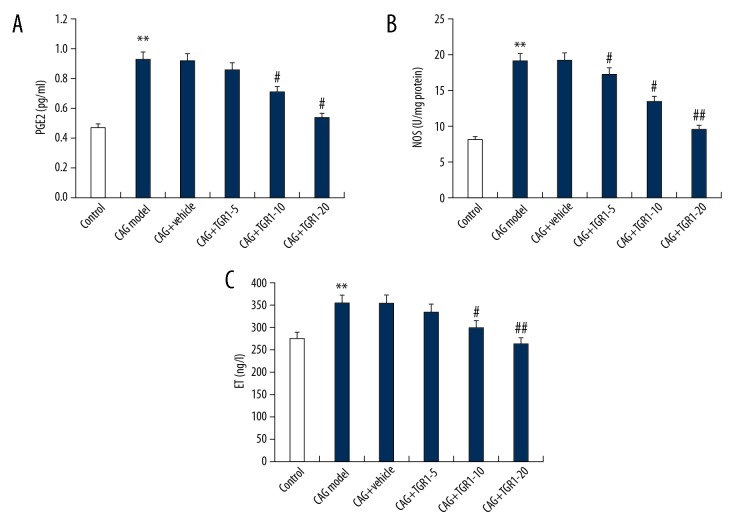
Figure 4.
Effect of NGR1 on PGE2, NOS, and ET expression in serum of rats with or without CAG. After specific treatment, the levels of PGE2 (A), NOS (B), and ET (C) expression in serum of rats with or without CAG were detected using ELISA. Control: rats without any treatment; CAG Model: rats were treated with MNNG; CAG+Vehicle: rats were treated with MNNG and administered sterile distilled water; CAG+TGR1–5: rats were treated with MNNG and administered 5 mg/kg/day NGR1; CAG+TGR1–10: rats were treated with MNNG and administered 10 mg/kg/day NGR1; CAG+TGR1–20: rats were treated with MNNG and administered 20 mg/kg/day NGR1. Data are displayed as mean ±SD. ** p<0.01 vs. Control group; #, ## p<0.05, 0.01 vs. CAG model group.

