
Figure 3.
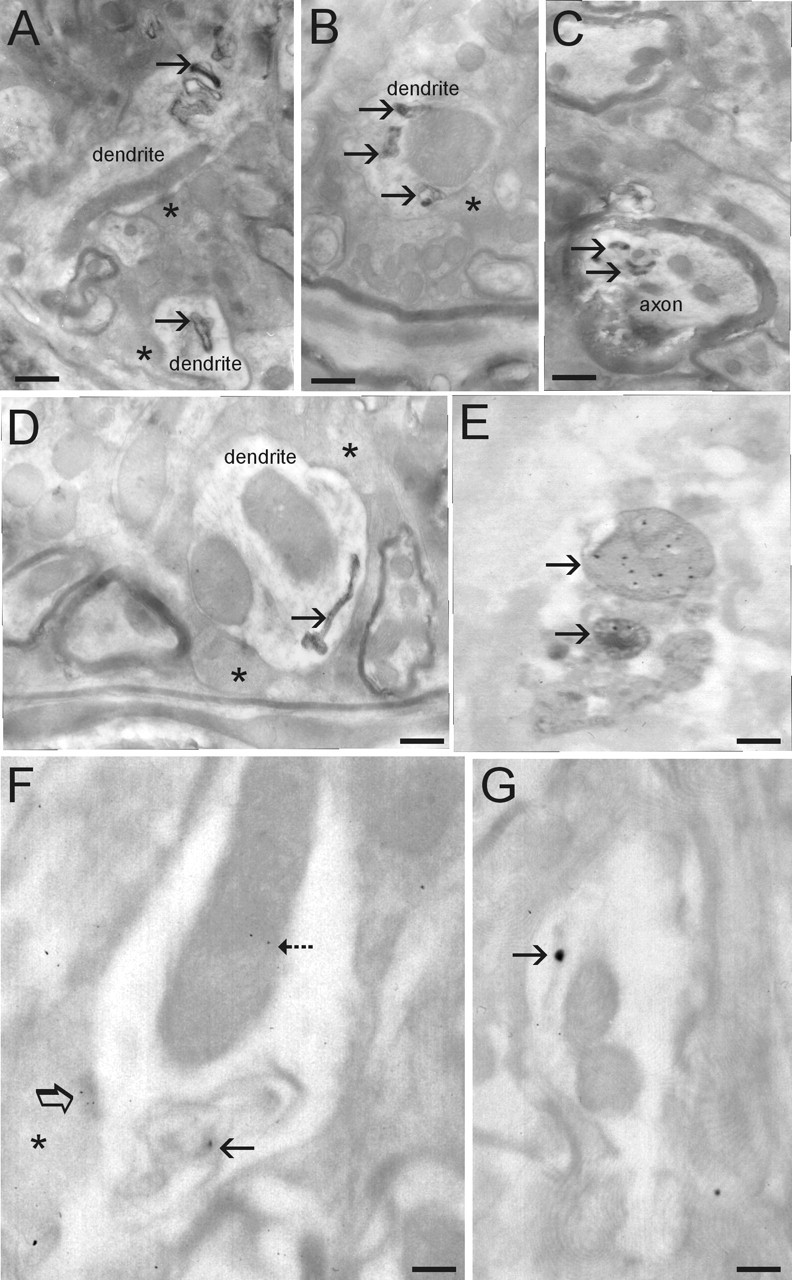
Ultrastructural evaluation of inclusions and mitochondrial degeneration in A53T mice. A, Dendrite profiles with inclusions (arrows). Asterisks identify presynaptic terminals on dendrites. B, Dendrite profile with large dilated mitochondrion (compare size with other mitochondria in the surrounding neuropil) that is associated with several electron-dense inclusions (arrows). C, Myelinated axonal profile containing several electron-dense inclusions (arrows). Axon profile at top of image appears normal. D, Dendrite profile containing anelectron-dense inclusion with a tubular shape and dilated at one end. E, Immunogold EM for Cox-I showing that some electron-dense inclusions are degenerating mitochondria. F, Immunogold EM for human α-syn showing its localization to mitochondria (dashed arrow) and abnormal inclusions (solid arrow) within a dendrite and to active zones of presynaptic terminals (asterisk, open arrow). G, Immunogold EM for human α-syn showing its localization to tubular inclusions (arrow; compare inclusion with one shown in D). E–G, Electron micrographs are fromt hins sections not contrasted to show more clearly the colloidal gold particles. Scale bars: A, 0.25 μm; B, 0.18 μm; C, 0.18 μm; D, 0.12μm; E, 0.1μm; F, 0.08μm; G, 0.09μm.