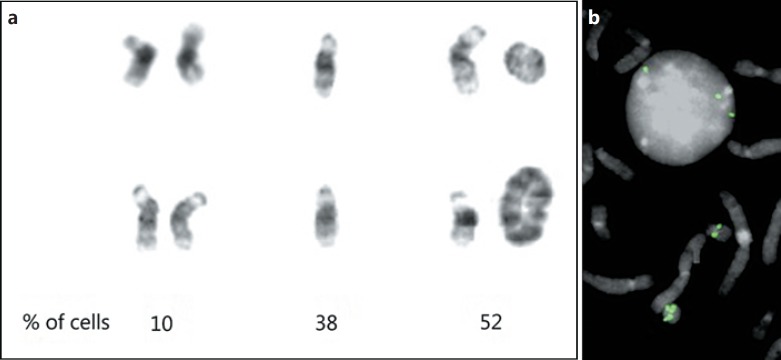
Fig. 1.
Chromosomes 21 from the patient cells. a Two normal G-banded chromosomes 21 (left), monosomy 21 (middle), and differently sized rings (right). The ring in the upper right is a double ring structure, as discussed in the text. The numbers below the columns indicate the percentage of cells with that constitution based on cytogenetic analysis of 50 cells. b Nucleus and partial metaphase after hybridization with a FISH probe from 21q21.1 showing 3 FISH signals on the nucleus, a single copy on the normal 21, and 2 copies on the basic ring at the bottom of the image.

