Fig. 2.
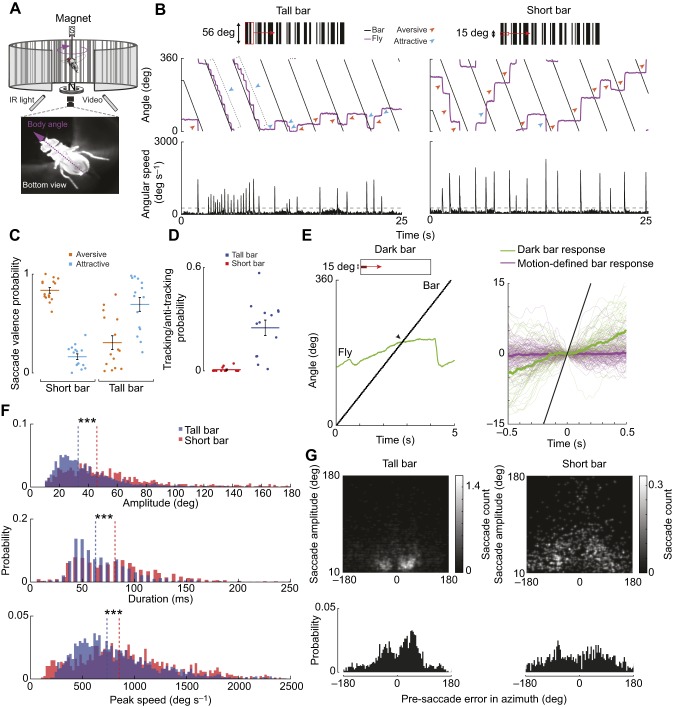
Bar height influences saccade tuning in a magnetic tether. (A) Flies were suspended magnetically and free to rotate about the yaw axis. We used high-speed video (160 frames s−1) and offline image processing to track the fly's body angle. Flies were illuminated with IR light. (B) Left: a fly fixates a moving tall bar (56 deg height, full vertical height of arena) by generating bouts of attractive saccades and some aversive saccades. Right: flies generate a primarily aversive saccade in response to a moving short bar (15 deg height). Virtual object width=30 deg. Bottom: angular speed of fly body angle. Gray dotted line: computed saccade detection threshold. Bar speed: 113 deg s−1. (C) Distribution of saccade valence probability during the presentation of a tall and short bar. Thick line: mean. Error bar: s.e.m. Individual dots are the mean for an individual fly. (D) Probability of flies generating bouts of tracking saccades via sustained, co-directional saccades covering 180 deg of the arena. Thick line: mean. Error bar: s.e.m. Individual dots are the mean for an individual fly. (E) Left: example response to motion of a small, dark bar via smooth movement and saccades. Arrow indicates midline crossing. Right: comparison of inter-saccade body angles during the presentation of short, motion-defined (red) and dark (green) bars. t=0 s is the fly's visual midline. Thick line: median. Stimulus: black line. Stimulus speed=75 deg s−1. n=5 flies, 80 trials. (F) Histograms of saccade amplitude, duration and peak angular speed for a tall bar (blue) and a short bar (red). ***P≤0.001. Dashed lines: median. (G) Top: colormap of pre-saccade error in azimuth versus saccade amplitude for motion-defined tall and short bars. 0 deg is the fly's visual midline. Bottom: probability histogram of pre-saccade error angles. For C,D,F,G: n=14 animals, 150 trials total.

