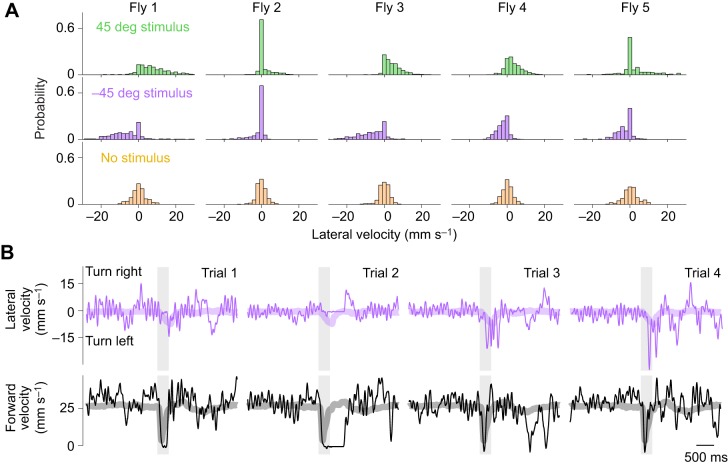
Fig. 3.
Trial-to-trial variation in phonotaxis behavior. (A) Distribution of single-trial lateral velocity values (at stimulus offset) for five example flies. Histograms are normalized so they have the same area. (B) Randomly selected examples of one typical fly's responses to sounds from the left (−45 deg). Periodic fluctuations in lateral velocity correspond to individual strides (Gaudry et al., 2013). Thick lines are the trial-averaged data for this fly.

