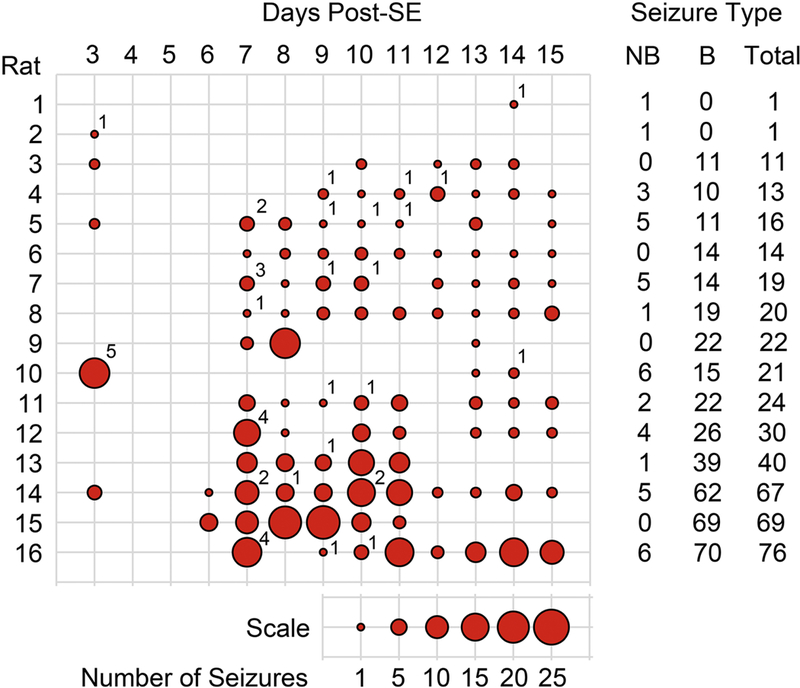
Figure 1. Seizure Burden After Pilocarpine-Induced SE.

Implanted rats were recorded with an automatic video-EEG system to obtain continuous recordings (24 hours a day). A trained technician examined EEG and video recordings off-line to identify electrographic seizures. Behavioral characterization of seizures was based on the Racine scale. Summary of the number of seizures (behavioral and non-behavioral) detected on the 16 rats included in the current study presented as seizures per day. The size of the circles represents the number of seizures per day according to the scale provided. The number on the upper right of the circles depicts the number of non-behavioral seizures detected on that particular day. A summary of the number of non-behavioral (NB), behavioral (B) and total seizures for each animal is presented as columns on the right side of the figure. The number located at the upper right side of the circles represents the number of NB seizures detected on a particular day. After EEG and video recording, tissue of one group of 8 rats was collected for western blot analysis and another group of 8 rats was collected for histological analysis.
