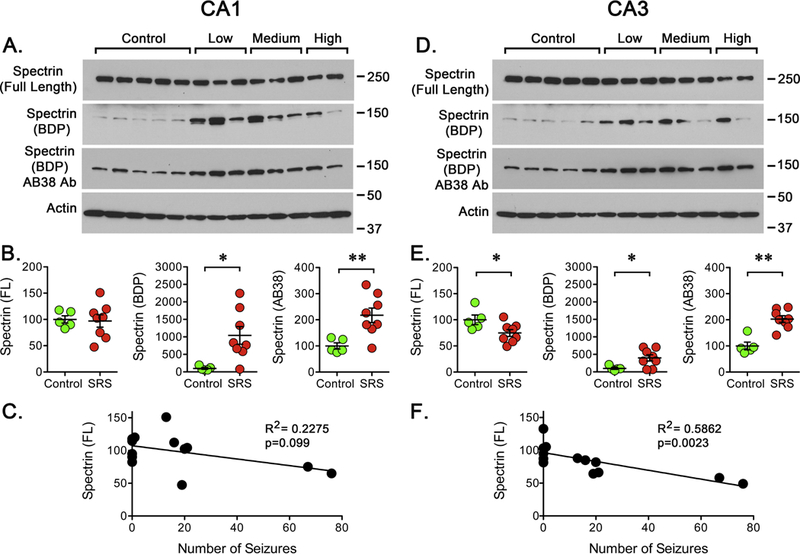
Figure 2. Calpain Activation After SRS.

Hippocampal tissue was collected at 15 days post-SE. Western blot analysis was performed using antibodies to detect μ-spectrin and its BDPs (anti-μ-spectrin and AB38). The blots were also probed for actin immunoreactivity as control. (A, D) Representative western blots showing the detection of full-length μ-spectrin and BDPs in CA1 or CA3 of hippocampus. (B, E) Quantitation of the immunoreactivity detected for full-length μ-spectrin and BDPs in CA1 or CA3 regions of hippocampus in samples obtained from controls (n=5) and rats that experienced a “low”, “medium” or “high” number of SRS prior to sacrifice (n=8). Data is presented as the mean ± SEM. (C, F) Values were compared using an unpaired f-test, *p<0.05 or **p<0.01. Values obtained for full-length μ-spectrin were paired with the number of SRS detected during to days following the pilocarpine induced SE to perform a linear regression analysis. Plots display a significant correlation (R2=0.5862, p=0.0023) between the levels of full-length μ-spectrin and the number of SRS in CA3 but not in CA1.
