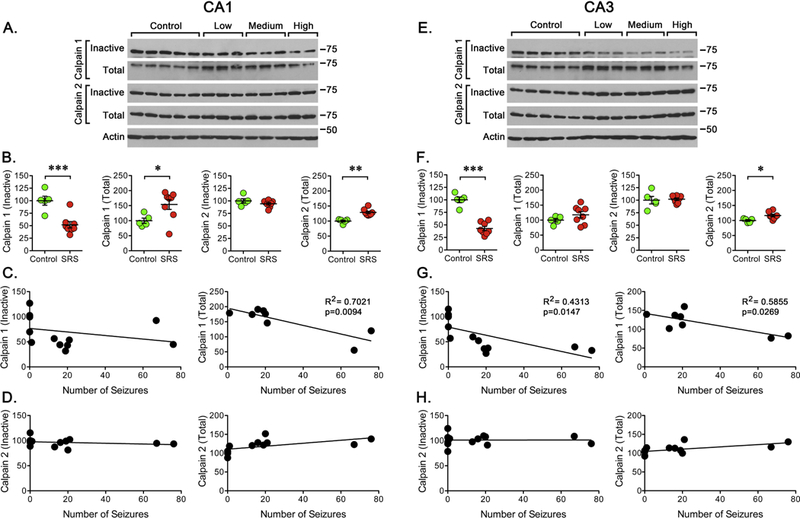
Figure 3. Calpain Activation/Expression After SRS.

Western blot analysis was performed using antibodies to detect “inactive” and “total” calpain-1 or calpain-2. (A, E) Representative western blots for the detection of “inactive” and “total” calpain-1 or calpain-2 in CA1 or CA3 regions. (B, F) Quantitation of the immunoreactivity detected for “inactive” and “total” calpain-1 and calpain-2 in controls (n=5) and rats that experienced a “low”, “medium” or “high” number of SRS (n=8). Data is presented as the mean ± SEM of the values obtained from samples of CA1 or CA3 regions. Values obtained for controls and SRS animals were compared using an unpaired f-test, *p<0.05, **p<0.01, or ***p<0.001. (C, G) To further analyze the data, values obtained for “total” calpain-1 were paired with the number of SRS detected prior to sacrifice to perform a linear regression analysis. Plots displayed a significant correlation between total calpain-1 (R2=0.7021, p=0.0094) in CA1 and both “inactive” (R2=0.4313, p=0.0147) and “total” (R2=0.5855, p=0.0269) calpain-1 in CA3. (D, H) As for the inactive or total levels of calpain-2, no significant correlation was detected for the levels of “inactive” calpain but a significant correlation was found for “total” calpain-2 in CA1 (p=0.0366) and CA3 (p=0.0305).
