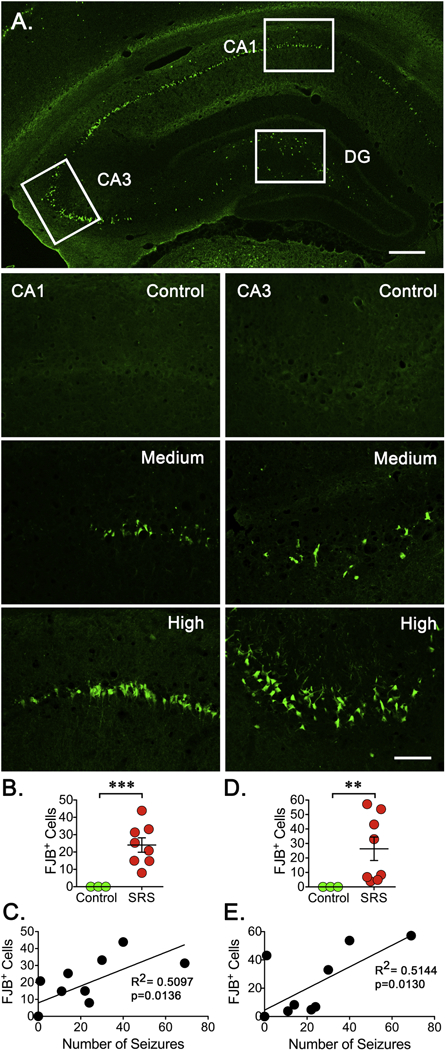
Figure 4. Neuronal Degeneration After SRS.

Three fixed coronal sections (15 μm) were selected from a 1 -in-10 series. A. Low magnification image (4X) from the hippocampus of the animal enduring the highest number of SRS was stained with the anionic fluorochrome Fluoro-Jade B (FJB) showing a clear pattern of neurodegeneration along the principal neurons within the CA1 and CA3 regions. In DG, the hilus is the main site where positive cells can be seen. The approximate location where 20X pictures for the CA1, CA3 and DG were taken is depicted. Scale bar represents 200 μm. (B, E) Representative sections (20X) stained with FJB show degenerating neurons in the CA1 and CA3 regions of hippocampus. Scale bar represents 100 μm. (C, F) The number of FJB positive (FJB+) cells was counted on the three sections selected and averaged to represent the number of FJB+ cells detected in a particular animal. Cell counts were conducted blinded to seizure frequency. Data is presented as the mean ± SEM of controls (n=3) and animals experiencing SRS (n=8). The number of FJB+ cells was compared using an unpaired f-test, **p<0.01 and ***p<0.001 represent a significant difference. (D, G) Values obtained for the number of FJB+ cells were paired with the total number of SRS detected to perform a linear regression analysis (n=8). Plots display a significant correlation between the levels of FJB+ cells and the number of SRS detected in the CA1 (R2=0.5097, p=0.0136) and CA3 (R2=0.5144, p=0.0130) regions of hippocampus.
