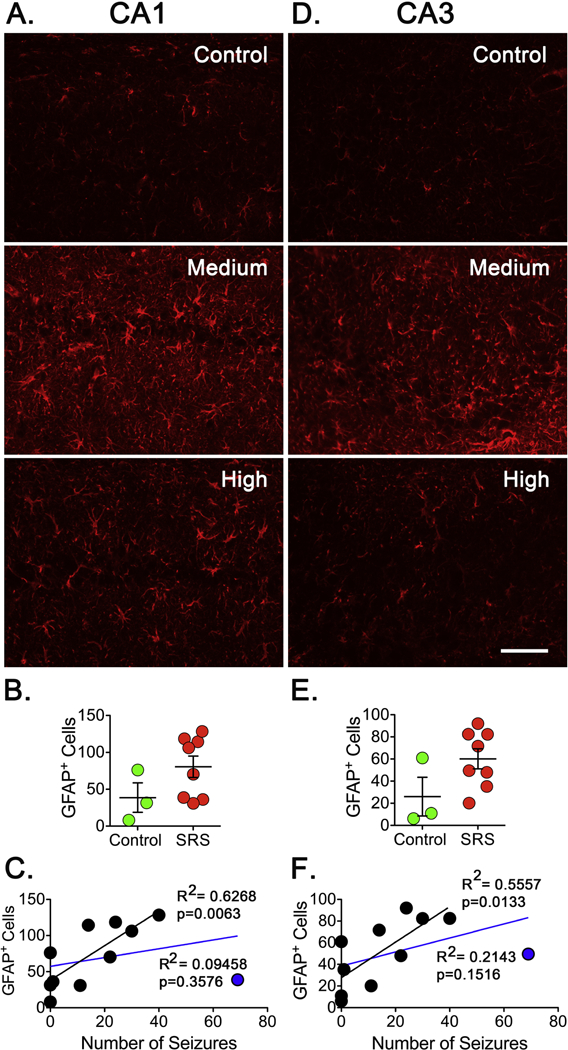
Figure 7. Reactive Astrocytes After SRS.

Coronal sections (15 μm) were selected from a 1-in-10 series started at approximately the same level of hippocampus. (A, D) Sections were stained with GFAP antibodies to detect reactive astrocytes in CA1 and CA3 regions of hippocampus. Scale bar represents 100 μm. (B, E). The number of GFAP+ cells was determined on the three sections and the average represents the number of GFAP+ cells in a particular animal. Cell counts were conducted blinded to seizure frequency. Data is presented as the mean ± SEM of controls (n=3) and animals that experienced SRS (n=8). No significant difference in the number of GFAP+ cells was detected using an unpaired t-test. (C, F) The number of GFAP+ cells was paired with the number of SRS detected in a linear regression analysis. Plots did not show a significant correlation in CA1 or CA3 regions of hippocampus when all animals were included (blue line). When an animal experiencing the highest number of seizures (blue dot) was not included in the analysis (black line), the plots displayed a significant correlation between the levels of GFAP+ cells and the number of SRS detected in CA1 (R2=0.6268, p=0.0063) and CA3 (R2=0.5557, p=0.0133).
