Fig. 6.
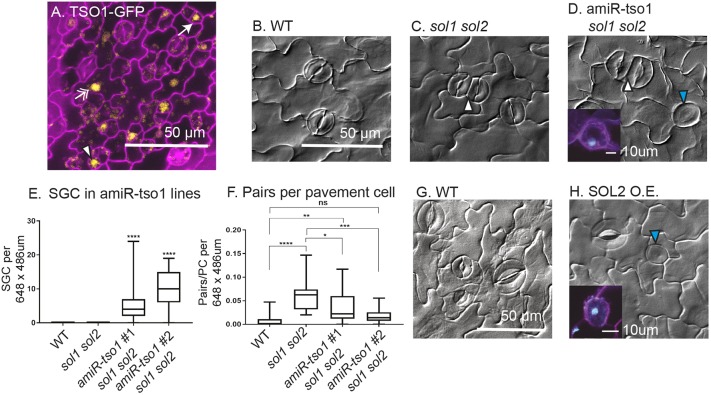
Depletion of TSO1 in sol1 sol2 background or overexpression of SOL2 results in similar guard cell division defects. (A) Confocal image of TSO1p:TSO1-GFP reporter in a wild-type background expressed throughout epidermis, in meristemoids (arrow), GMCs (arrowhead) and pavement cells (double arrow). (B-D) DIC images of 21 dpg adaxial true leaves in wild type (B), in sol1 sol2 (stomatal pair indicated by a white arrowhead) (C) and in amiR-tso1 sol1 sol2 (stomatal pair indicated by white arrowhead and SGC by blue arrowhead) (D). (E) Quantification of SGC number per field of view (wild type, n=27; sol1 sol2, n=29; amiR-tso1 #1 sol1 sol2, n=31; amiR-tso1 #2 sol1 sol2, n=19). (F) Number of stomatal pairs in field of view normalized to account for an overall increase in cell number (wild type, n=20; sol1 sol2, n=24; amiR-tso1 #1 sol1 sol2, n=30; amiR-tso1 #2 sol1 sol2, n=18). (G,H) DIC images showing production of SGCs upon SOL2-YFP overexpression (H). Insets in D and H are confocal images of SGCs with stained nuclei (cyan). For all box and whisker plots, whiskers extend to minimum and maximum; box indicates interquartile range (25th percentile to 75th percentile) with center line indicating median. *P<0.05, **P<0.01, ***P<0.001, ****P<0.0001, Dunn's multiple comparison test.

