Fig. 4.
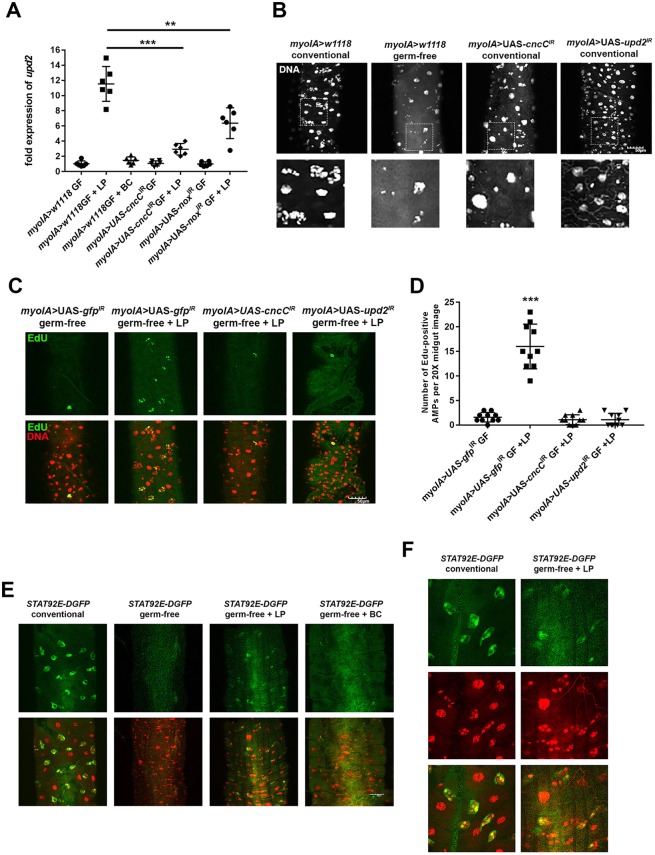
L. plantarum upregulates upd2 expression in the larval midgut. (A) Measurement of upd2 transcript levels in third instar larval midguts of the indicated genotypes. Germ-free larvae were mono-associated with either L. plantarum (LP) or B. cereus (BC) for 4 h. All upd2 transcript levels were normalized to levels that were detected in the conventionally raised myoIA>w1118 flies, which serve as control groups with an isogenic genetic background, and were averaged and set to a value of 1. For each data point, five larval intestines were pooled and total RNA was extracted. (B) Third instar larvae posterior midgut tissue from the indicated genotypes. Note fewer AMPs, with many niches only harboring one AMP per niche/island following EC-specific depletion of CncC or Upd2. Bottom panels show magnified views of boxed areas. (C) Detection of EdU-positive cells in the midgut of germ-free Drosophila third instar larvae of the indicated genotypes following mono-association with L. plantarum for 24 h. (D) Quantification of EdU-positive cells in the midgut of phenotypes indicated in C. Note significant increase in the numbers of proliferating AMPs in response to L. plantarum in control, but not in myoIA>UAS-upd2IR or with myoIA>UAS-cncCIR. (E) Detection of GFP-positive cells in the midgut of larvae that harbor a JAK/STAT-responsive 10XSTAT92E-DGFP reporter fly. GFP levels were compared between germ-free larvae and larvae mono-associated with L. plantarum or with B. cereus for 24 h. (F) Higher-magnification images of 10XSTAT92E-DGFP reporter detailed in E, showing colocalization of GFP expression with the smaller nuclei AMPs following L. plantarum feeding. **P<0.01 (nonparametric unpaired t-test); ***P<0.001 (unpaired t-test). n=6 in A; n=10 in D. Quantifications show mean values (middle bars) and s.e.m. (outer bars); individual datapoints plotted. Scale bars: 50 μm.

