Fig. 2.
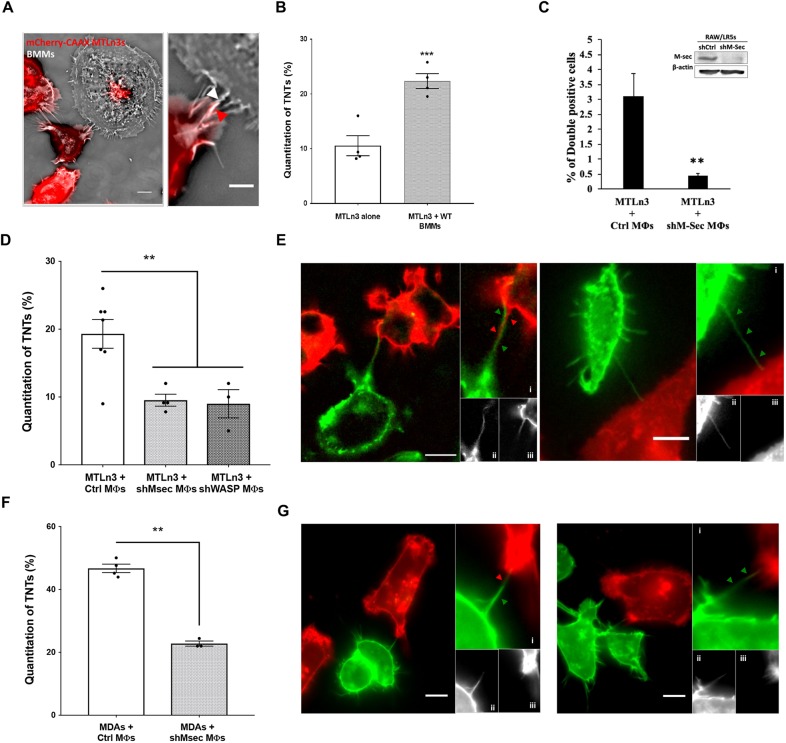
Heterotypic TNTs between tumor cells and macrophages are functional and can be quantified using live-cell imaging. (A) Co-culture between primary bone marrow-derived macrophages (BMMs) and MTLn3 mCherry–CAAX tumor cells, showing the formation of TNTs between the different cell type (heterotypic). Right panel shows a zoomed area where a TNT is connecting both cell types, arrows indicate that TNT is composed of tumor cell (red arrowhead) and BMM (white arrowhead) membrane. Scale bars: 10 μm (main images), 5 μm (inset). (B) Mean±s.e.m. number of TNTs after overnight co-culture represented as the percentage of TNTs formed between BMMs and MTLn3 tumor cells (gray bar) for a population of n>64 cells for each experiment and compared to TNTs formed between tumor cells alone (clear bar). (C) RAW/LR5 macrophages are labeled with DiI prior to co-culture with GFP–CAAX MTLn3 tumor cells. Using flow cytometry, we quantified the population of DiI-positive GFP-expressing MTLn3 cells, indicating the transfer of DiI-labeled material in the case of co-culture with control or shM-Sec (TNT deficient) macrophages. Data are the mean±s.e.m. of 3 independent experiments. Inset shows western blot analysis of M-Sec levels in shControl and shM-Sec RAW/LR5 s (full blots can be seen in Fig. S2). (D) Mean±s.e.m. percentage of TNTs between mCherry–CAAX-labeled tumor cells and GFP–CAAX-labeled control and shM-Sec or shWASP RAW/LR5 macrophages. (E,G) Live-cell images of TNTs between MTLn3 tumor cells (E) or MDA-MB-231 tumor cells (G) stably expressing mCherrry–CAAX, and macrophages expressing GFP–CAAX plasmid to label the cell membrane. Left panels: A TNT is formed between a tumor cell (red) and a RAW/LR5 macrophage (green). Panels (i) show a zoomed area of the TNT formed by wrapping of membrane from both cell types. Panels (ii) and (iii) show individual channels. Right panels: A TNT is formed solely from a macrophage. Panels (i) shows a zoomed area of the TNT formed of macrophage membrane. Panels (ii) and (iii) show individual channels. Scale bars: 10 μm. (F) Mean±s.e.m. percentage of TNTs formed between mCherry–CAAX-labeled MDA-MB-231 tumor cells and GFP–CAAX-labeled control and shM-Sec RAW/LR5 macrophages. Data in all graphs are represented as histograms representing the overall mean of at least three independent experiments. Individual values of the number of TNT connections for each independent experiment in each case are indicated as dots. *P<0.05; **P<0.02; ***P<0.003; ns, not significant by Student's t-test.

