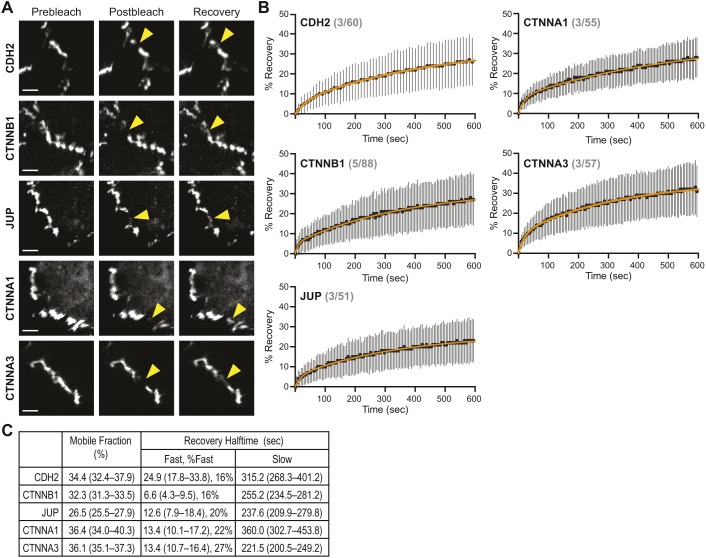
Fig. 2.
Adherens junction protein dynamics at cardiomyocyte cell–cell contacts. (A) Representative pre-bleach, post-bleach and recovery images from FRAP studies of cells expressing GFP-tagged CDH2, CTNNB1, JUP, CTNNA1 and CTNNA3. Yellow arrowheads mark the FRAP region along a cell–cell contact. Scale bars: 50 µm. (B) Plots of mean±s.d. FRAP recovery fraction over time. The data were fit to a double exponential curve (orange line). Values in gray show number of experiments/FRAP contacts quantified for each protein. (C) Summary of the mobile fraction (as percentages) and recovery halftimes (fast and slow pools). The percentage of the fast pool also listed.

