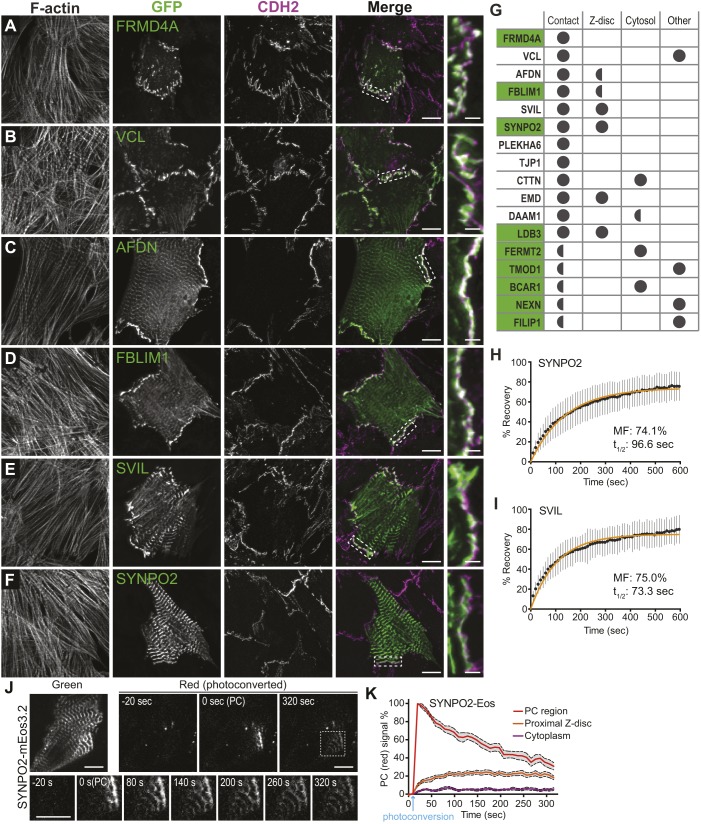
Fig. 7.
CDH2 interactome proteins localize to cell–cell contacts and Z-discs. (A–F) Cardiomyocytes transfected with GFP-tagged CDH2–BioID2 hits as indicated. Cells were fixed 24 h post-transfection and stained for CDH2 and F-actin. All images are maximum projections of deconvolved z-stacks. Individual and merged GFP (green) and CDH2 (magenta) channels shown. Far right shows magnification of boxed contact in merge image. (G) Summary of GFP–CDH2–BioID2 interactome localization to cell–cell contacts, Z-discs, cytosol or other. Full circle indicates robust localization, half circle indicates modest localization. Proteins highlighted in green are unique to the CDH2 interactome. Representative images for PLEKHA6, TJP1 (paralog of TJP2), CTTN, EMD, DAAM1, LDB3, FERMT2, TMOD1, BCAR1, NEXN and FILIP1 are shown in Fig. S4. (H,I) Plot of mean±s.d. FRAP recovery fraction over time for SYNPO2 (30 FRAP regions from two independent experiments) and SVIL (18 FRAP regions from two independent experiments) at Z-discs. The data were fit to a single exponential curve (orange line). Mobile fraction (MF) percentage and recovery halftimes (t1/2) listed. (J) Dynamics of photoconverted SYNPO2-mEos3.2 in transfected cardiomyocytes. Green channel shows total SYNPO2-mEos3.2 protein. Red channel shows photoconverted protein before activation (−20 s), immediately after photoconversion [0 s (PC)] and after 320 s. Bottom montage shows a magnified view of photoconverted protein (boxed region in top right 320 s panel) over time. (K) Quantification of photoconverted SYNPO2-mEos3.2. Mean percentage of photoconverted protein (red signal) for the photoconverted area (PC region, red line), Z-disc 2–3 μm outside the photoconverted region (Proximal Z-disc, orange line) and cytoplasm 2–3 μm outside the photoconverted region (Cytoplasm, purple line) plotted over time. Dashed lines and gray region around mean define the s.e.m. Time of photoconversion marked with a blue arrow. Data is from 12 photoconverted cells from two independent experiments. Scale bars: 10 µm in A–F,J.

