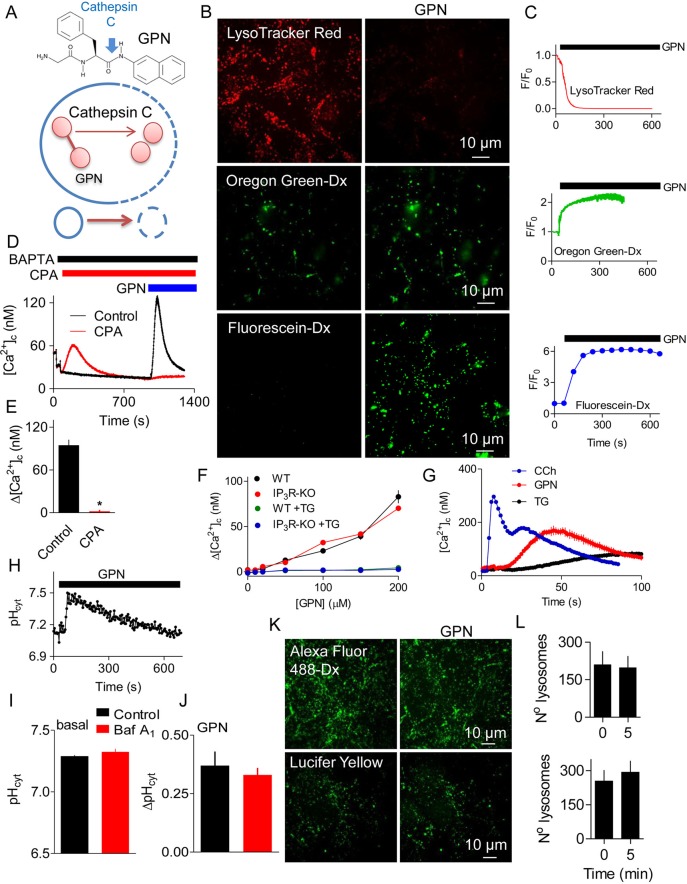
Fig. 1.
GPN changes pH and [Ca2+]c without rupturing lysosomes. (A) GPN is proposed to disrupt lysosomes because its cleavage by cathepsin C (blue arrow) causes osmotic lysis. (B) HEK cells loaded with LysoTracker Red, or with dextran conjugates of Oregon Green or fluorescein report an increase in pHly after addition of GPN (200 µM for 200 s). Increased pH causes fluorescence to decrease for LysoTracker Red and increase for the other indicators. (C) Time courses of GPN-evoked changes in fluorescence (F/F0) of the pHly indicators. Each trace shows mean±s.d. from 3–4 ROIs in a single cell (summarised in Fig. 3F,H). (D) BAPTA (2.5 mM) was added to chelate extracellular Ca2+, and cyclopiazonic acid (CPA, 20 µM) to inhibit SERCAs, before the addition of GPN (200 µM) to fluo 8-loaded HEK cells. Results show mean±s.d. for 3 replicates. (E) Summary results (mean±s.e.m., n=3) from analyses similar to those in panel D show peak increase in [Ca2+]c (Δ[Ca2+]c) evoked by GPN. *P<0.05, Student's t-test. (F) Wild-type HEK cells (WT) or HEK cells without IP3Rs (IP3R-KO) kept in Ca2+-free HBS were either stimulated with 200 µM GPN alone or treated with 1 µM thapsigargin (TG) for 15 min followed by addition of 200 µM GPN. Results (mean±s.e.m., n=4, with 3 replicates) show Δ[Ca2+]c. The green symbols are obscured by the overlying blue symbols. (G) Initial responses of HEK cells to carbachol (CCh, 1 mM), GPN (200 µM) or thapsigargin (TG, 1 µM) in Ca2+-free HBS (mean±s.d. of 3 replicates). A summary of these data is shown in Fig. S1C,D. (H) Effect of GPN (200 µM) on pHcyt determined using the pH indicator SNARF-5F in populations of HEK cells. (I,J) Effects of bafilomycin A1 (Baf A1, 1 µM, 1 h) on basal pHcyt (I) and on the ΔpHcyt evoked by GPN (200 µM, 200 s) (J). Results (mean±s.e.m., n=5, each with 3 replicates) show no significant effect of BafA1 (Student's t-test). (K) Representative confocal images show that GPN (200 µM, 10 min) had no effect on the punctate distribution of endocytosed Lucifer Yellow (Mr 447) or Alexa Fluor 488-coupled dextran (Mr ∼10,000). (L) Number of lysosomes identified before (0 min) and 5 min after GPN addition in at least 3 cells per coverslip. Mean±s.e.m., n=3 independent coverslips (Alexa Fluor 488-Dx, top graph) and n=4 independent coverslips (Lucifer Yellow, bottom graph).

