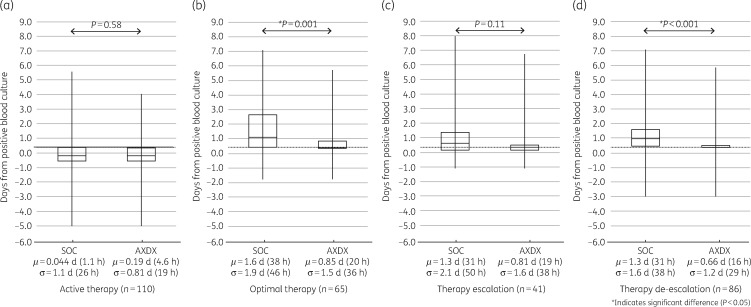
Figure 2.
All-patient therapy intervention times. SOC compared with theoretical AXDX for (a) active therapy, (b) optimal therapy when possible, (c) first escalation of therapy when required and (d) first de-escalation of therapy when possible. Box plots display median and IQR with tails indicating the minimum and maximum of observed values, and the notes below show the mean (μ) and standard deviation (σ). The grey dotted line represents mean AXDX AST time (9.0 h) for reference.

