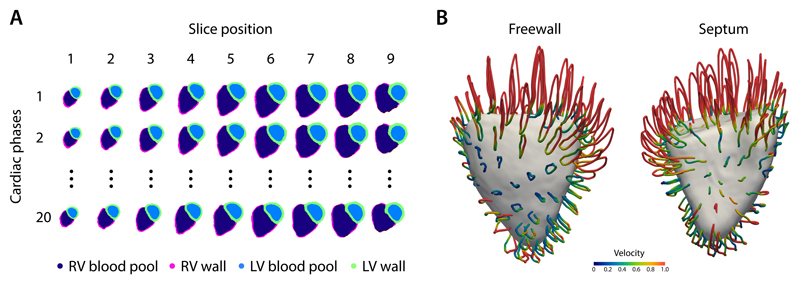
Figure 1.
A) An example of an automatic cardiac image segmentation of each short-axis cine image from apex (slice 1) to base (slice 9) across 20 temporal phases. Data were aligned to a common reference space to build a population model of cardiac motion. B) Trajectory of right ventricular contraction and relaxation averaged across the study population plotted as looped pathlines for a sub-sample of 100 points on the heart (magnification factor of x4). Colour represents relative myocardial velocity at each phase of the cardiac cycle. A surface-shaded model of the heart is shown at end-systole. These dense myocardial motion fields for each patient were used as an input to the prediction network. LV, left ventricular; RV, right ventricular.

