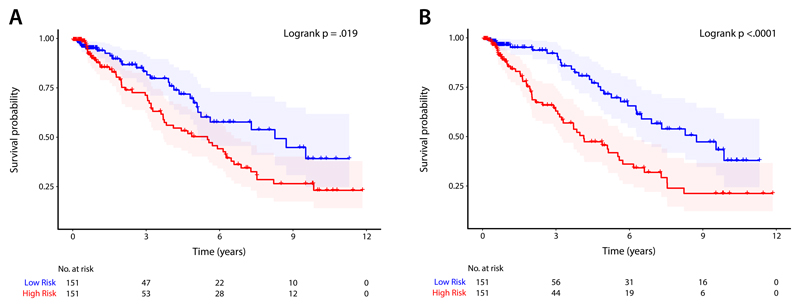
Figure 2.
Kaplan-Meier plots for A) a conventional parameter model using a composite of manually-derived volumetric measures, and B) a deep learning prediction model (4Dsurvival) whose input was time-resolved three dimensional models of cardiac motion. For both models, patients were divided into low- and high-risk groups by median risk score. Survival function estimates for each group (with 95% confidence intervals) are shown. For each plot, the Logrank test was performed to compare survival curves between risk groups (conventional parameter model: χ2 = 5.5, p = .019; 4Dsurvival: χ2 = 15.6, p < .0001)

