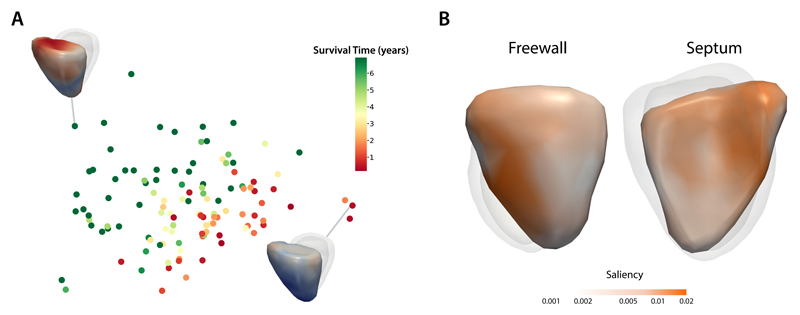
Figure 3.
A) A 2-dimensional projection of latent representations of cardiac motion in the 4Dsurvival network labelled by survival time. A visualisation of RV motion is shown for two patients with contrasting risks. B) Saliency map showing regional contributions to survival prediction by right ventricular motion. Absolute regression coefficients are expressed on a log-scale.

