
Figure 1. Generation of human stem cell molecular signatures.
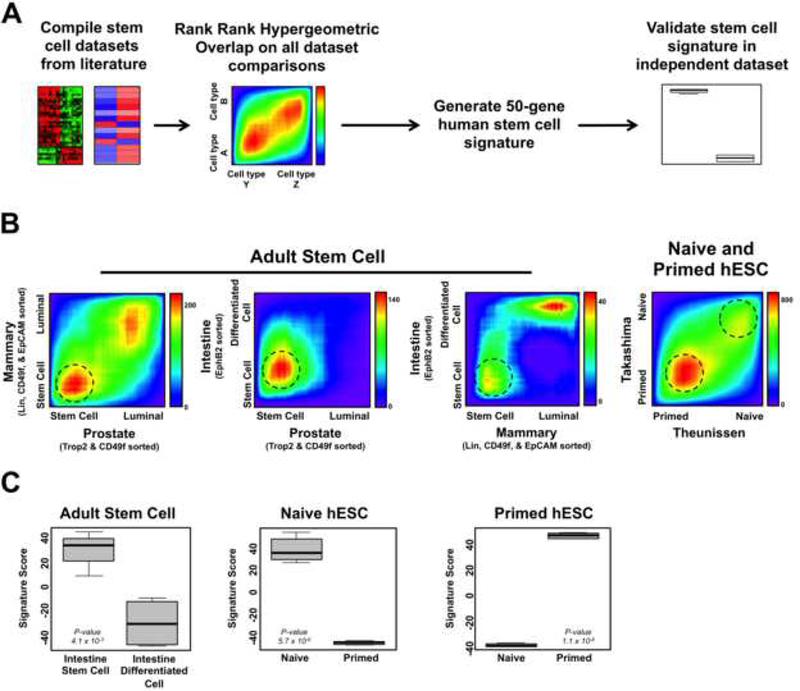
(A) Schematic for generating human stem cell gene expression signatures. (B) Rank-rank hypergeometric overlap heatmap plots for normal human epithelial cell dataset comparisons used to generate stem cell signatures. Dotted circles indicate regions where genes were derived from to generate the signatures. Heatmap scale bars = -log10 p-value. (C) Human stem cell signature scores in validation datasets. Intestine stem cell: n = 4, Intestine differentiated cell: n = 4, Naive: n = 6, Primed: n = 5. Mean ± SD. See also Figure S1 and Table S1.