
Figure 2. The human adult stem cell signature selects for aggressive epithelial cancer phenotypes.
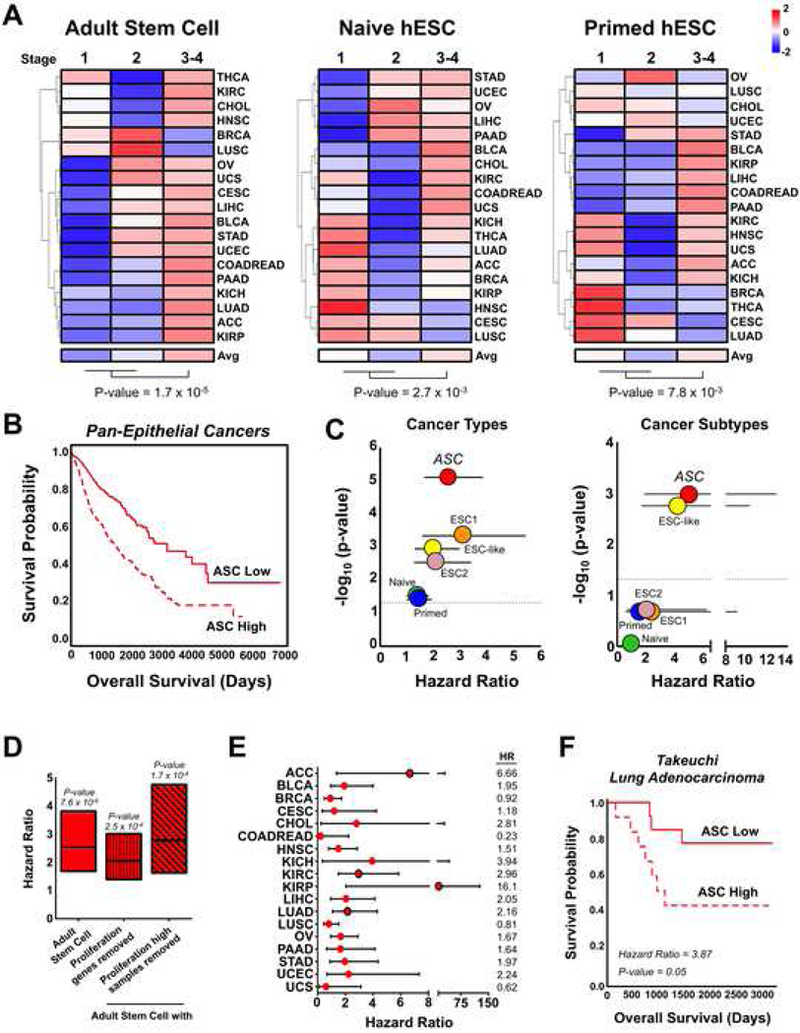
(A) Unsupervised clustering of TCGA epithelial cancers according to average stem cell signature scores for cancer stages. Scale color key is based on z-scores. (B) Overall survival of ASC signature associated samples in TCGA epithelial cancers. ASC High: n = 1097, ASC Low: n = 923. (C) P-values and hazard ratios for human stem cell signatures in the pan-epithelial cancer dataset after controlling for covariates including cancer types or cancer molecular subtypes. Mean ± 95% CI. Dotted line indicates a p-value = 0.05. (D) Hazard ratios for the ASC signature with and without removal of proliferation associated signals. Min and max bars represent the 95% CI. (E) Hazard ratios for ASC signature enriched samples according to cancer lineage. Red circles outlined in black indicate a p-value < 0.05. Min and max bars represent the 95% CI. (F) Overall survival of ASC signature stratified lung adenocarcinoma samples from Takeuchi et al., 2006. ASC High: n = 12, ASC Low: n = 13. See also Figure S2.