
Figure 3. The ASC signature is associated with epithelial cancers exhibiting genomic alterations in developmental regulators and small cell neuroendocrine lung cancers.
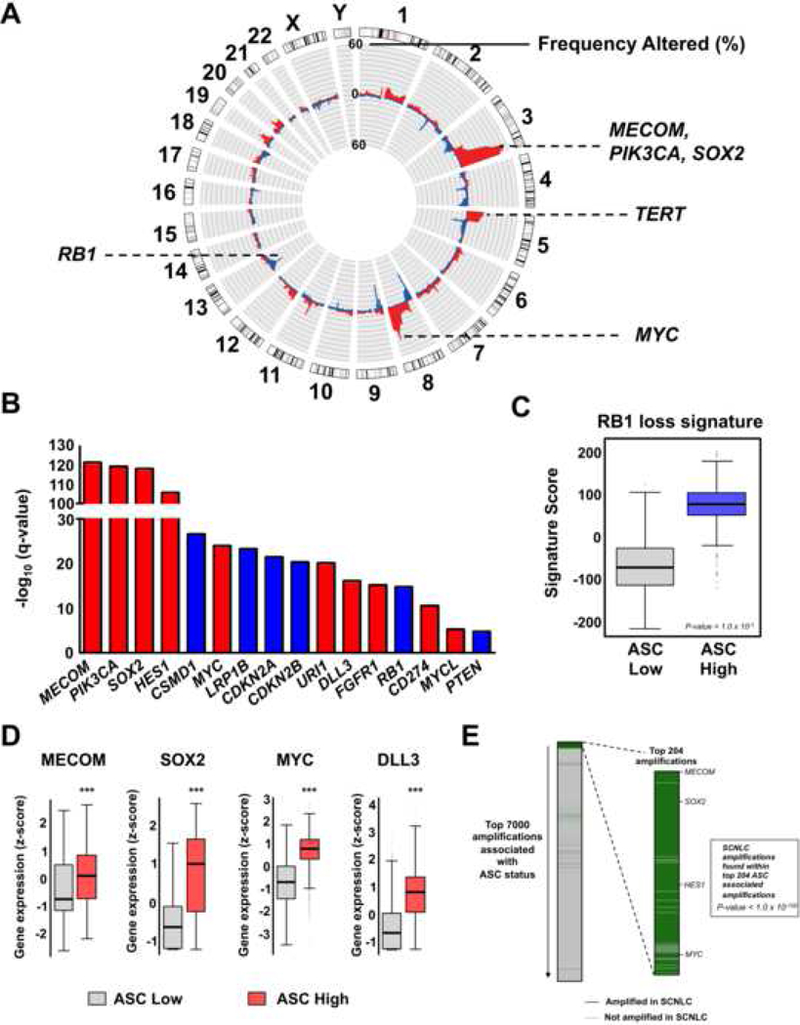
(A) Copy number amplifications (red) and deletions (blue) associated with the ASC signature. Alterations are plotted according to the frequency in ASC-associated samples. (B) Notable genes significantly associated with ASC signature status. Red denotes genes that are significantly amplified and blue bars indicate genes that are significantly deleted. (C) RB1 loss-of-function signature in ASC stratified samples. Mean ± SD. (D) Expression of notable genes in ASC signature High and Low samples. Mean ± SD. ***P-value < 1.0 × 10⁻³. (E) Small cell neuroendocrine lung cancer (SCNLC) amplifications that are associated with ASC status. All SCNLC amplifications encoding protein-coding genes (Rudin et al., 2012) were found within the top 7000 amplifications associated with ASC status as ordered according to amplification frequency. Of the 290 common protein-coding gene amplifications found in SCNLC and associated with ASC, 181 were within the top 204 amplifications associated with ASC status (p-value < 1.0 × 10−100). See also Figure S3, Table S2, Table S3, and Table S4.