
Figure 5. Other molecular signatures do not significantly influence the ASC signature’s enrichment in small cell neuroendocrine cancers.
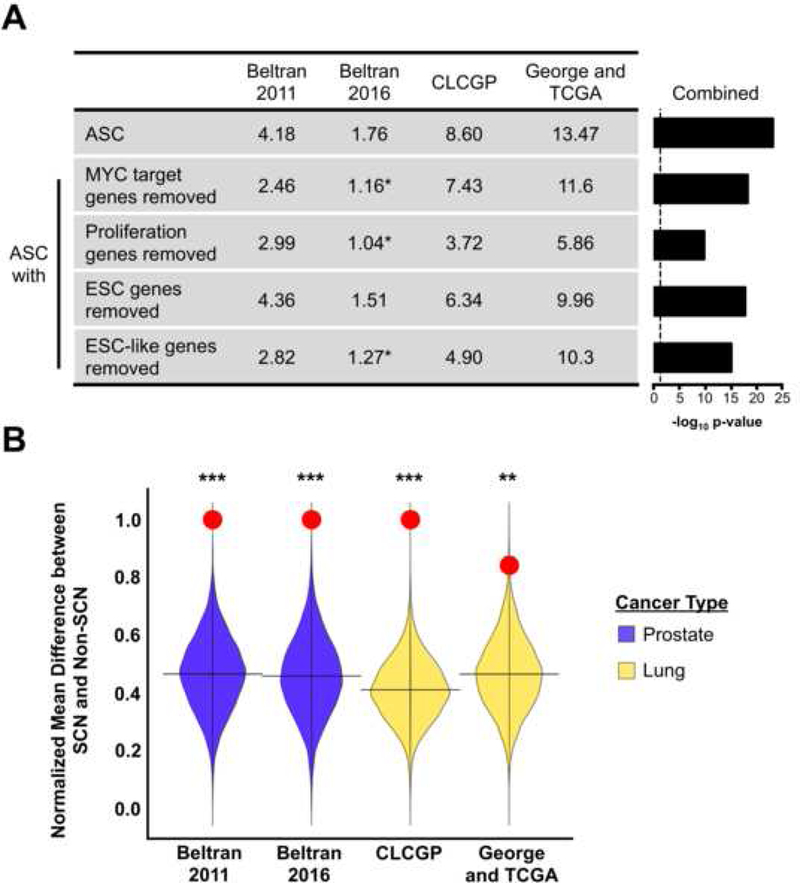
(A) Summary of gene signature enrichment in the small cell neuroendocrine phenotype for each dataset. Values represent-log10 p-values. indicates signatures that did not reach a p-value < 0.05 in the respective dataset. Dotted line represents the-log10 p-value for p = 0.05. (B) Permutation analysis comparing ASC signature (red circle) to random 50-gene signature scores in the indicated prostate and lung cancer datasets. ***Permutation p-value < 1.0 × 10⁻⁴, **P-value = 3.3 × 10⁻³.