
Figure 6. DNMT1 is overexpressed in small cell neuroendocrine prostate and lung cancers.
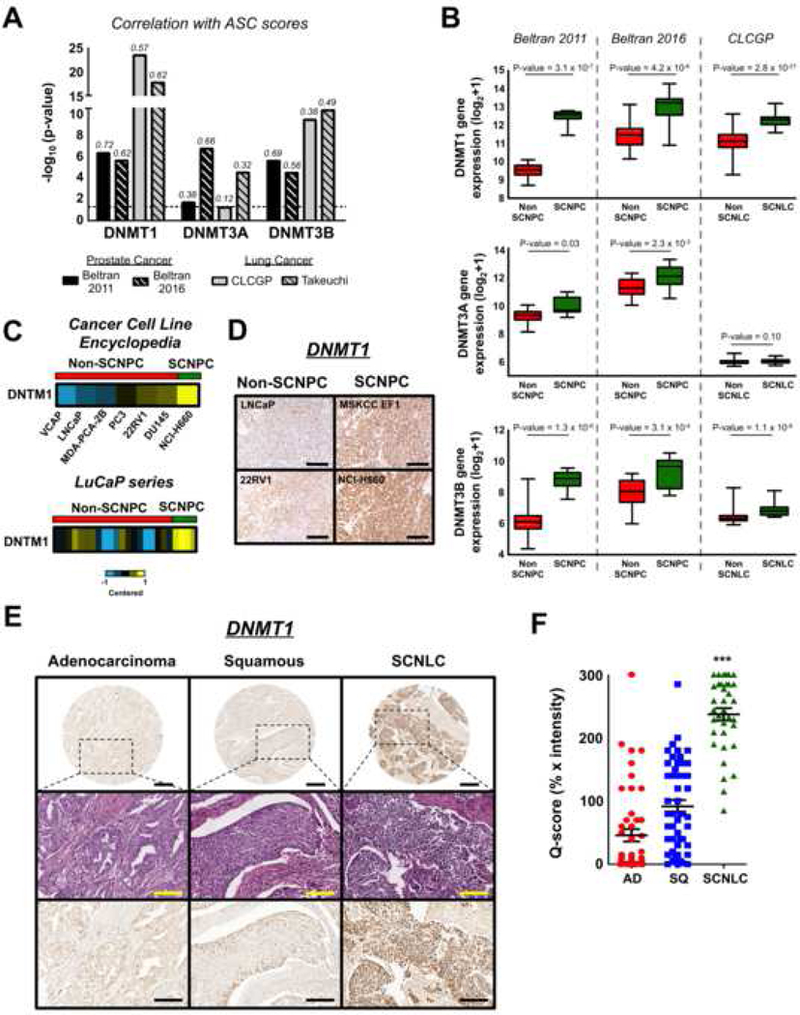
(A) Correlation of DNMT expression with ASC signature scores in prostate and lung cancer cohorts. Correlation values are shown above the individual bars. (B) DNMT gene expression in prostate and lung cancer phenotypes. Mean ± SEM. ***P-value < 0.001. (C) DNMT1 expression in prostate cancer cell lines (top, from Cancer Cell Line Encyclopedia), and patient derived xenografts (bottom, LuCaP series). LuCaP xenografts: SCNPC n = 4, Non-SCPC n = 20. (D) DNMT 1 immunostaining of prostate cancer xenograft tissue. Scale bar = 100 μm. (E) DNMT1 immunohistochemistry of lung cancer clinical samples. Top row images: scale bar = 500 μm; middle and bottom row images: scale bar = 200 μm. (F) DNMT1 immunohistochemical staining scores for the lung cancer clinical samples. AD: adenocarcinoma (n = 48), SQ: squamous cell carcinoma (n = 49), SCNLC: n = 35. Mean ± SEM. ***P-value < 1.0 × 10⁻⁵.