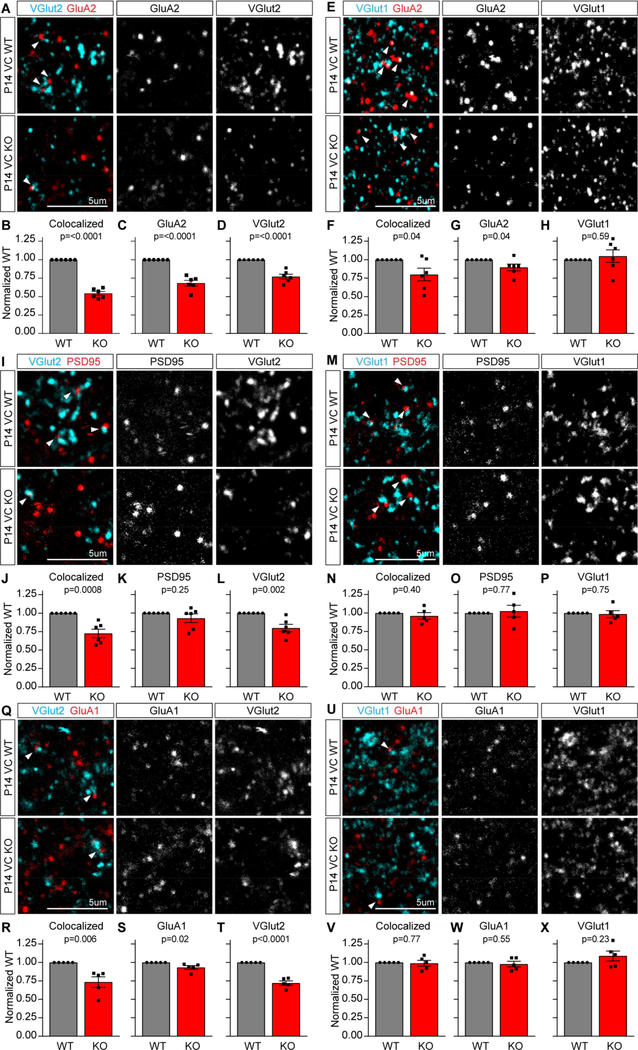
Figure 5. Chrdl1 is necessary to increase GluA2 AMPARs at cortical synapses.
(A-H) Chrdl1 regulates synaptic GluA2 levels. (A,E) Example images of WT (top) and Chrdl1 KO (bottom) P14 visual cortex sections immunostained for GluA2 and VGlut2 (A) or VGlut1 (E). (B-D,F-H) Quantification of immunostaining: Chrdl1 KO shows significant decrease in GluA2 at thalamocortical VGlut2 synapses (B) and intracortical VGlut1 synapses (F); significant decrease in GluA2 puncta (C,G); significant decrease in presynaptic VGlut2 puncta (D) with no difference in VGlut1 (H). N=6 WT, 6 KO mice VGlut2 and VGlut1. (I-P) Chrdl1 regulates thalamocortical synapse formation. (I,M) Example images of WT (top) and Chrdl1 KO (bottom) P14 visual cortex sections immunostained for PSD95 and VGlut2 (I) or VGlut1 (M). (J-L,N-P) Quantification of immunostaining: Chrdl1 KO shows significant decrease in colocalization of PSD95 with VGlut2 at thalamocortical synapses (J); no change in colocalization of PSD95 with VGlut1 at intracortical synapses (N); no change in PSD95 puncta (K,O); significant decrease in presynaptic VGlut2 puncta (L) with no difference in VGlut1 (P). N=6 WT, 6 KO mice VGlut2; N=5 WT, 5 KO mice VGlut1. (Q-X) Chrdl1 regulates thalamocortical synaptic GluA1. (Q,U) Example images of WT (top) and Chrdl1 KO (bottom) P14 visual cortex sections immunostained for GluA1 and VGlut2 (Q) or VGlut1 (U). (R-T,V-X) Quantification of immunostaining: Chrdl1 KO shows significant decrease in colocalization of GluA1 with VGlut2 at thalamocortical synapses (R); no change in colocalization of GluA1 with VGlut1 at intracortical synapses (V); no large change in GluA1 puncta (S,W); significant decrease in presynaptic VGlut2 puncta (T) with no difference in VGlut1 (X). N=5 WT, 5 KO mice VGlut2 and VGlut1. Scale bar = 5μm. Bar graphs mean±s.e.m., with individual data points representing mice. Statistics by T-test, significance as stated on graph. See also Figure S4,S5,S6; Tables S2,S3,S4.

