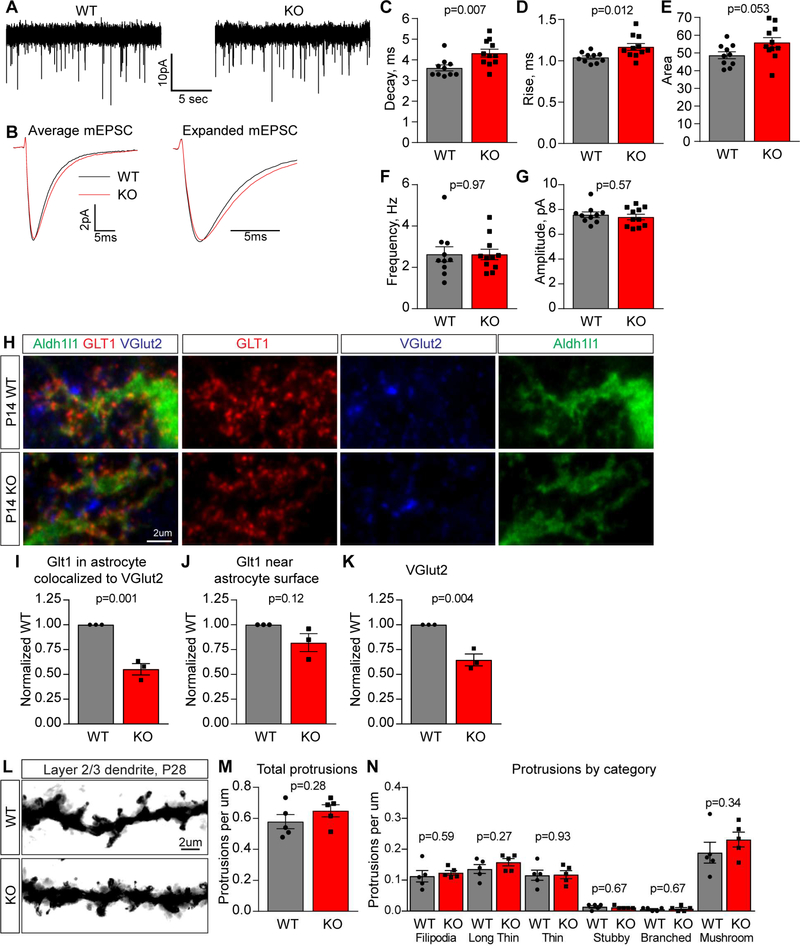
Figure 6. Chrdl1 regulates mEPSC kinetics at L2/3 synapses in the developing visual cortex.
(A-G) Chrdl1 KO mice display altered mEPSC kinetics in the developing visual cortex at P14. (A) Example mEPSC recordings from layer 2/3 pyramidal neurons in acute visual cortex slices. (B) Average mEPSC from all recordings aligned to rise time (left) and expanded timescale (right). (C-G) Quantification of mEPSCs: Chrdl1 KO mEPSC kinetics are altered, with increased decay time (C), rise time (D) and area (E); mEPSC frequency (F) and amplitude (G) are not altered. N=10 cells WT, 11 cells KO. (H-K) Astrocyte glutamate transporters are not significantly altered at synapses in Chrdl1 KO mice. (H) Example images of WT (top) and Chrdl1 KO (bottom) P14 visual cortex sections immunostained for GLT1 and VGlut2 along with Aldh1l1-GFP to mark astrocytes. (I-K) Quantification of immunostaining: Chrdl1 KO shows significant decrease in presynaptic VGlut2 puncta (K), no change in GLT1 on astrocytes (J) and a significant decrease in GLT1 colocalized with VGlut2 (I). N=3 WT, 3 KO mice. (L-N) No alteration in spine density in layer 2/3 neurons at P28 in Chrdl1 KO. (L) Example images of dendrites and spines visualized using Golgi staining. (M) Quantification of all dendritic protrusions, normalized per μm dendrite. (N) Quantification of spine types, normalized per μm dendrite. N=5 WT, 5 KO mice. Bar graphs mean±s.e.m., with individual data points representing cells (C-G) and mice (I-K, M-N). Statistics by T-test, significance as stated on graph. See also Figure S4,S5,S6; Tables S2,S3,S4.

