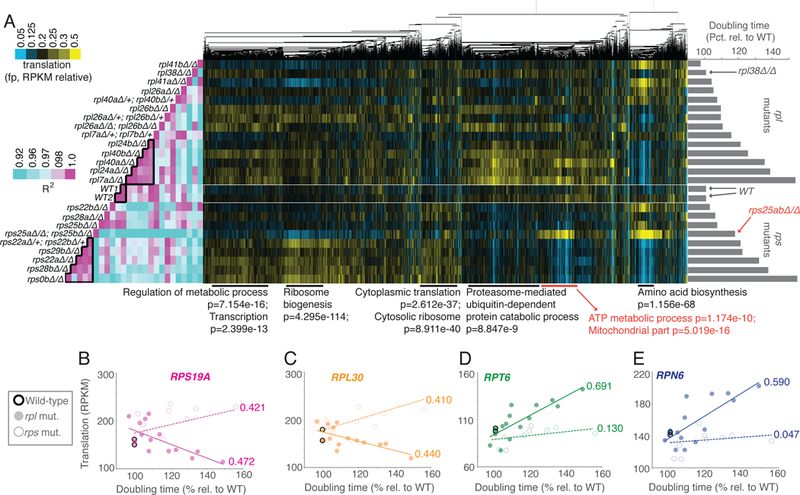
Figure 2:

Growth rate-linked translation patterns differ between rps and rpl mutant strains. See also Fig. S1, S2, S4, S5, File S1. A panel of mutants lacking genes encoding components of the large ribosomal subunit (60S; rpl) or small ribosomal subunit (40S, rps) were subjected to growth rate analysis (bar graphs at right) and ribosome profiling (middle). Ribosome profiling data were clustered by similar expression patterns for genes across all mutants. Columns are normalized to allow comparison. Note that the rpl or rps mutant strains that are most defective for growth showed the most highly correlated patterns of translation to within each group but not between the two (Pearson correlation, left, two boxed in pink region in middle and at bottom). Note that the rpl data in this figure is the same as represented in Figure 1, analyzed in parallel with growth-matched rps mutants here. Below are GO enrichment categories and H-B p-values, with rps25-specific cluster information in red. B-E) Data for rpl (solid dot) and rps (open dot) mutants are plotted for representative RP genes B) RPS19A, C) RPL30 and representative proteasome genes D) RPT6 and E) RPN6. R2 -values based on Pearson correlation are included next to lines of best fit.
