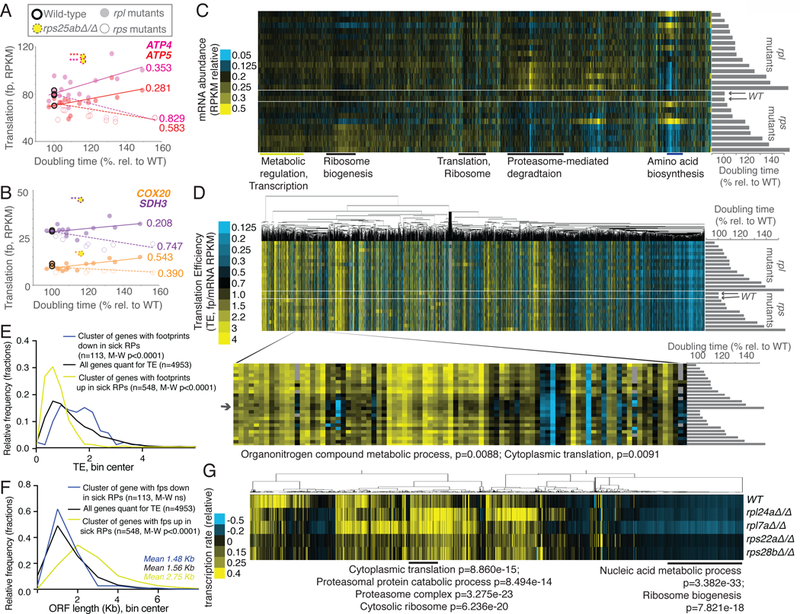
Figure 3:

Analyses of genome-wide gene expression data suggest effects of ribosome concentration on translation and secondary effects of cellular growth rate on transcription. See also Fig. S1, S2, S4, S5, Files S1 and S2. A) and B) Data for rpl (solid dot) and rps (open dot) mutants are plotted for genes involved in ATP metabolism, ATP4, ATP5, COX20, and SDH3. Yellow dash-encircled dots represent rps25aΔrps25bΔ cells, which show a divergent trend from growth matched rps mutants. R2-values are included next to lines of best fit and are based on Pearson correlations, *values represent divergence from line of best fit for rps mutants, with *representing >2 standard deviations (SD) from expectation, **>4 SD, ***>7 SD. C) mRNA-seq data, resulting from total-RNA-seq (no polyA-selection) from matched samples collected in parallel for all rps and rpl mutants shown in Fig 2A are shown. Genes (columns) are ordered as in Fig 2A (top: rpl41bΔ/Δ, rpl38Δ/Δ, rpl41aΔ/Δ, rpl26aΔ/Δ, rpl40aΔ/+ rpl40bΔ/+, rpl26bΔ/Δ, rpl26aΔ/+ rpl26bΔ/+, rpl26aΔ/Δ rpl26bΔ/Δ, rpl7aΔ/+ rpl7bΔ/+, rpl24bΔ/Δ, rpl40bΔ/Δ, rpl40aΔ/Δ, rpl24aΔ/Δ, rpl7aΔ/Δ, WT1, WT2, rps22bΔ/Δ, rps28aΔ/Δ, rps25bΔ/Δ, rps25aΔ/Δ rps25bΔ/Δ, rps22aΔ/+ rps22bΔ/+, rps29bΔ/Δ, rps22aΔ/Δ, rps28bΔ/Δ, rps0bΔ/Δ: bottom). Columns are normalized to allow comparison. Note overall similarity to translation data (Fig. 2, S5D). D) TE (translation efficiency, footprint/mRNA) values are shown for all genes quantified for mRNA abundance in C) and translation in Fig. 2A. Order of genes is matched to C). Genes (columns) are clustered according to similar patterns over all mutants (rows). Inset shows a discrete cluster of genes that show modestly lower TE values in rpl mutants with severe growth defects. Enrichment by H-B p-value analysis is shown below. E) The average wild-type TE values for the cluster of genes that show decreased translation in both growth-defective rpl and rps mutants in Fig. 2A (n=113) and the cluster with increased translation in both growth-defective rpl and rps mutants in Fig. 2A (n=548) are plotted and compared to the average wild-type TE values for all genes quantified (n=4953). Two-tailed Mann-Whitney (M-W) tests show that the genes with decreased ribosome footprints in growth-defective rp mutants have WT TE values that are significantly higher than the overall TE distribution and genes with increased ribosome footprints in growth-defective rp mutants have WT TE values that are significantly lower than the overall TE distribution. F) The ORF length distributions for the cluster of genes that show decreased ribosome footprints in both growth-defective rpl and rps mutants in Fig. 2A (n=113) and the cluster with increased ribosome footprints in both growth-defective rpl and rps mutants in Fig. 2A (n=548) are plotted and compared to the average wild-type ORF lengths for all genes quantified (n=4953). Two-tailed M-W tests show that the genes with increased ribosome footprints in growth-defective rp mutants have ORF lengths that are significantly higher than the overall ORF length distribution. G) Metabolic labeling was used to assay new mRNA synthesis (Chan et al., 2018), with quantification of labeled mRNAs by mRNA-seq analysis. Total signal per row was normalized, as was total signal per gene. GO terms and H-B-based p-values enriched in discrete clusters are labeled below.
