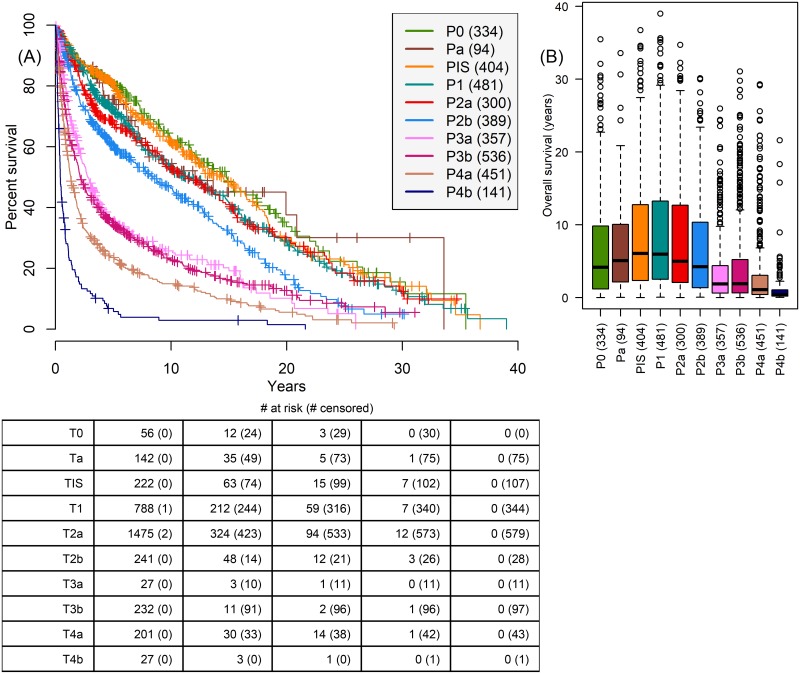
Fig 4. Relationship between survival and pT stage (TNM 5th edition) assigned at time of cystectomy.
(A) Kaplan-Meier survival shows a steadier degradation with tumor staging than clinical staging. (B) Boxplot of OS by pT stage at time of cystectomy clearly differentiates P3a and P3b patients from stage two patients. P-values in Table I in S1 File.

