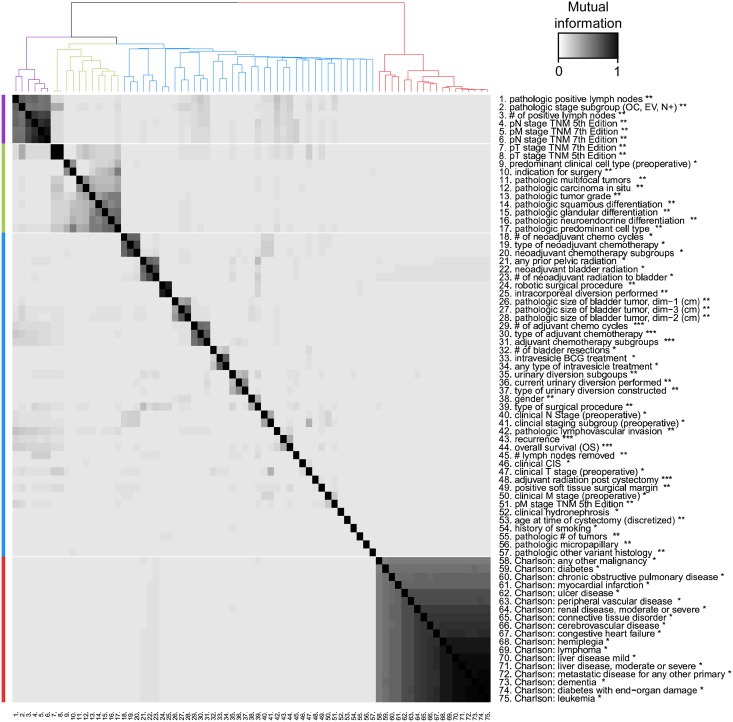
Fig 5. MI between the set of predictors, binary recurrence, and binary OS five years post-cystectomy.
Predictors are clustered into four groups using a hierarchical clustering algorithm to discover associated predictor groups. BCa predictors and long-term outcomes are contained in the purple (anatomic staging), green (histologic staging), and blue (treatment and OS and recurrence) clusters, whereas the comorbidity factors comprise a solitary (red) cluster. Correlations within the purple and red clusters are high, but correlations between the comorbidity cluster and other clusters is low. Predictors are measured at three time points: * before cystectomy, ** at time of cystectomy, *** post-cystectomy.

